The price of XRP has been consistently rising, moving above $1.40. It’s currently stabilizing around that level and could potentially climb higher, possibly exceeding $1.4120.
- XRP price started a steady increase above the $1.4080 zone.
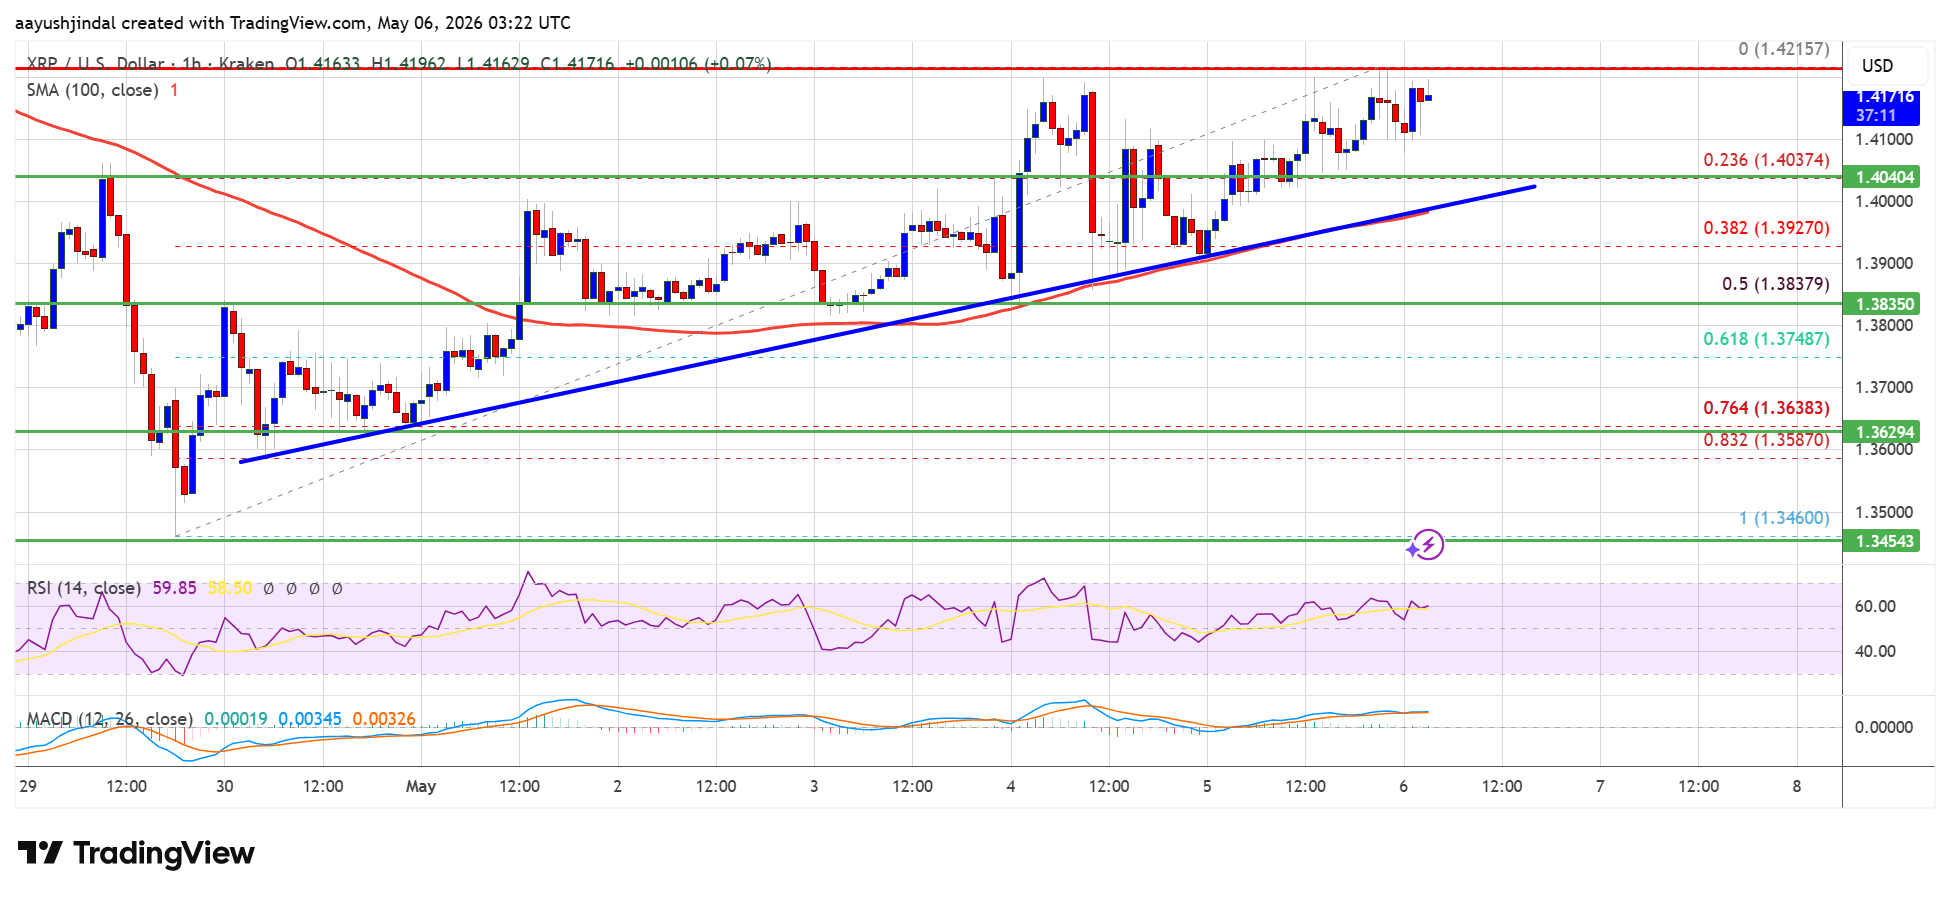
- The price is now trading above $1.4040 and the 100-hourly Simple Moving Average.
- There is a bullish trend line forming with support at $1.40 on the hourly chart of the XRP/USD pair (data source from Kraken).
- The pair could continue to move up if it settles above $1.4220.
XRP Price Aims for Fresh Increase
Similar to Bitcoin and Ethereum, the price of XRP began to rise, breaking past the $1.3980 and $1.40 levels. It then gained momentum, successfully moving above the $1.4150 resistance level.
The price briefly rose to around $1.4220, peaking at $1.4215. Now, the price is stabilizing, holding above a key support level defined by the 23.6% Fibonacci retracement of the recent move from $1.3460 to $1.4215.
The price of XRP has risen above $1.4040 and is now trading above its 100-hour moving average. A positive trend line is also developing, with support around $1.40 on the hourly chart.
If the price starts to rise, it could encounter some resistance around $1.42. A stronger push could lead to a test of $1.435, and breaking through that level might open the door to $1.45. Further gains could then target $1.474, with a significant challenge for buyers potentially appearing near $1.50.
Downside Correction?
If XRP doesn’t break through the $1.420 resistance level, its price might start to fall. It could initially find support around $1.40, following the existing trend line. Further down, a stronger support level exists near $1.3840, also along the trend line, or at the 50% retracement of the recent price increase from $1.3460 to $1.4215.
If the price falls below $1.3840, it could continue dropping to $1.3650. Further declines might find support around $1.350, but if that level is broken, the price could fall to $1.3250, with strong support expected near $1.3120.
Technical Indicators
Hourly MACD – The MACD for XRP/USD is now gaining pace in the bullish zone.
Hourly RSI (Relative Strength Index) – The RSI for XRP/USD is now above the 50 level.
Major Support Levels – $1.4000 and $1.3840.
Major Resistance Levels – $1.4200 and $1.4500.
Read More
- ETC PREDICTION. ETC cryptocurrency
- Gold Rate Forecast
- Brent Oil Forecast
- ONDO PREDICTION. ONDO cryptocurrency
- XRP EUR PREDICTION. XRP cryptocurrency
- EUR CNY PREDICTION
- GBP CHF PREDICTION
- IP/USD
- Jesse Hill’s Financial Fiasco: A Tale of Turboprops, Tropics, and Tortoise Payments 🐢💸
- UAE’s AI Dream: 50% Government by 2025?
2026-05-06 07:40