The price of XRP has recently dropped from around $1.40 and is now stabilizing. If it remains above $1.35, it could potentially rise again.
- XRP price started a downside correction after it failed to clear the $1.40 zone.
- The price is now trading above $1.350 and the 100-hourly Simple Moving Average.
- There is a bullish trend line forming with support at $1.3490 on the hourly chart of the XRP/USD pair (data source from Kraken).
- The pair could start a fresh increase if it settles above $1.3780.
XRP Price Dips Again
Similar to Bitcoin and Ethereum, XRP’s price began to rise, breaking past the $1.3550 and $1.3650 levels. This momentum pushed it towards and beyond the $1.380 resistance point.
The price initially reached a high of $1.3964 before starting to fall. It then broke below the $1.3680 and $1.360 levels. This decline took the price below the 50% Fibonacci retracement level, measured from the swing low of $1.320 to the high of $1.3964.
The price of XRP has risen above $1.350 and is now trading above its 100-hour moving average. A positive trend is also developing, with support around $1.3490, according to the hourly chart.
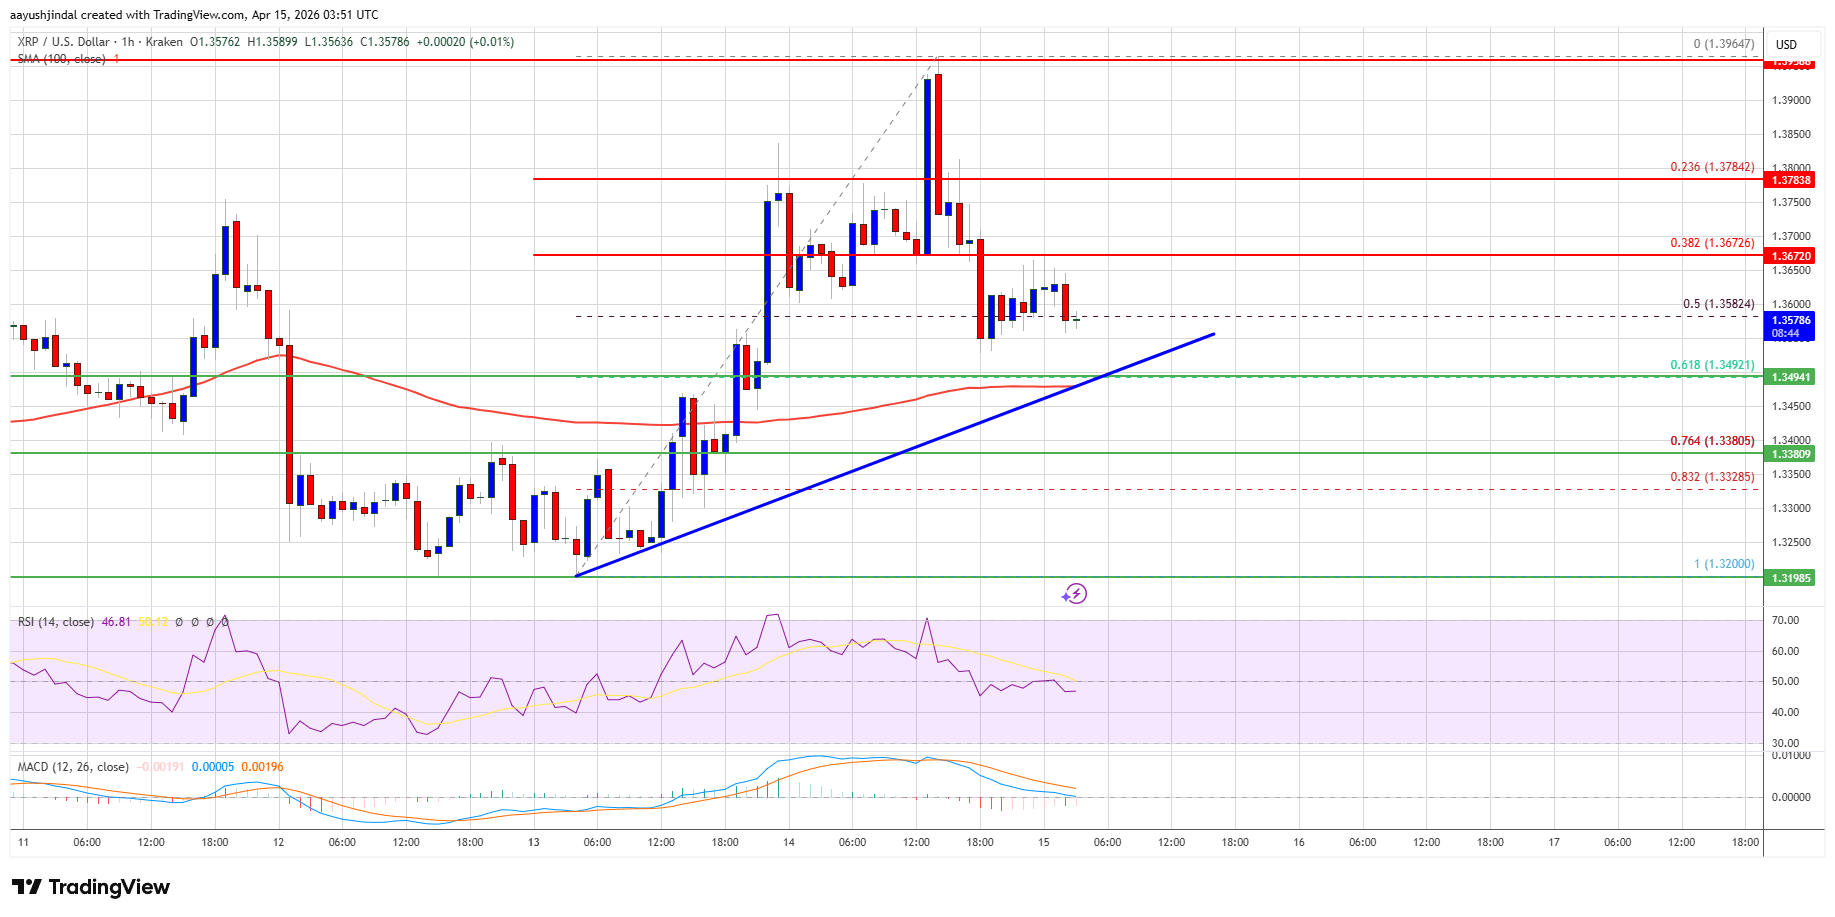
If the price starts to rise, it could encounter some resistance around $1.3680. Stronger resistance is expected near $1.3780, and breaking through that could lead to a test of $1.3880. If the price clearly surpasses $1.3880, it might move towards $1.40, with potential for further gains up to $1.4120. The next significant challenge for buyers could be around $1.4250.
Another Drop?
If XRP doesn’t break past the $1.3680 resistance level, its price might start to fall. It could first find support around $1.3550, and then at $1.350, which also aligns with a trend line and a key Fibonacci retracement level based on the recent price swing between $1.320 and $1.3964.
If the price falls below $1.350, it could continue dropping, potentially reaching $1.3380. Further declines might find support around $1.320, but breaking below that could lead to a move toward $1.30. Continued selling pressure could then target $1.2880.
Technical Indicators
Hourly MACD – The MACD for XRP/USD is now gaining pace in the bearish zone.
Hourly RSI (Relative Strength Index) – The RSI for XRP/USD is now below the 50 level.
Major Support Levels – $1.3500 and $1.3380.
Major Resistance Levels – $1.3680 and $1.3780.
Read More
- ETH PREDICTION. ETH cryptocurrency
- Gold Rate Forecast
- Warning: Binance-Listed Siren Token Rallies 30X—Here’s Why You Should Stay Away
- Altcoins About to Explode? You Won’t Believe What’s Next for These 4 in May 2025 🚀
- Trump’s Pick for Fed Chair: Kevin Warsh’s Billion-Dollar Crypto & AI Empire
- Brent Oil Forecast
- Ethereum’s Transaction Surge: Price Dives, But Who Cares? The Blockchain Party Continues!
- USD INR PREDICTION
- Bitcoin’s Rally: The Unlikely Hero of the Financial World! 🚀💰
- UK’s iCloud Backdoor Drama: Crypto Wallets in Peril 🚨
2026-04-15 07:16