Ethereum has been steadily building potential for a significant price move after being confined within a narrowing trading range for months. With market volatility currently at historically low levels, a breakout is likely – it could either signal a strong price increase or a further drop in value.
This report examines daily and 4-hour price charts to identify important levels, patterns, and potential outcomes for Ethereum traders.
The Bigger Picture: Falling Wedge and Macro Fib Levels
Since reaching a peak in October 2025, Ethereum’s price has been moving within a narrowing pattern called a falling wedge. This pattern shows a series of decreasing highs and lows, and it’s expected to reach a critical point around late April or early May 2026. At that time, Ethereum is likely to make a significant move in either direction.
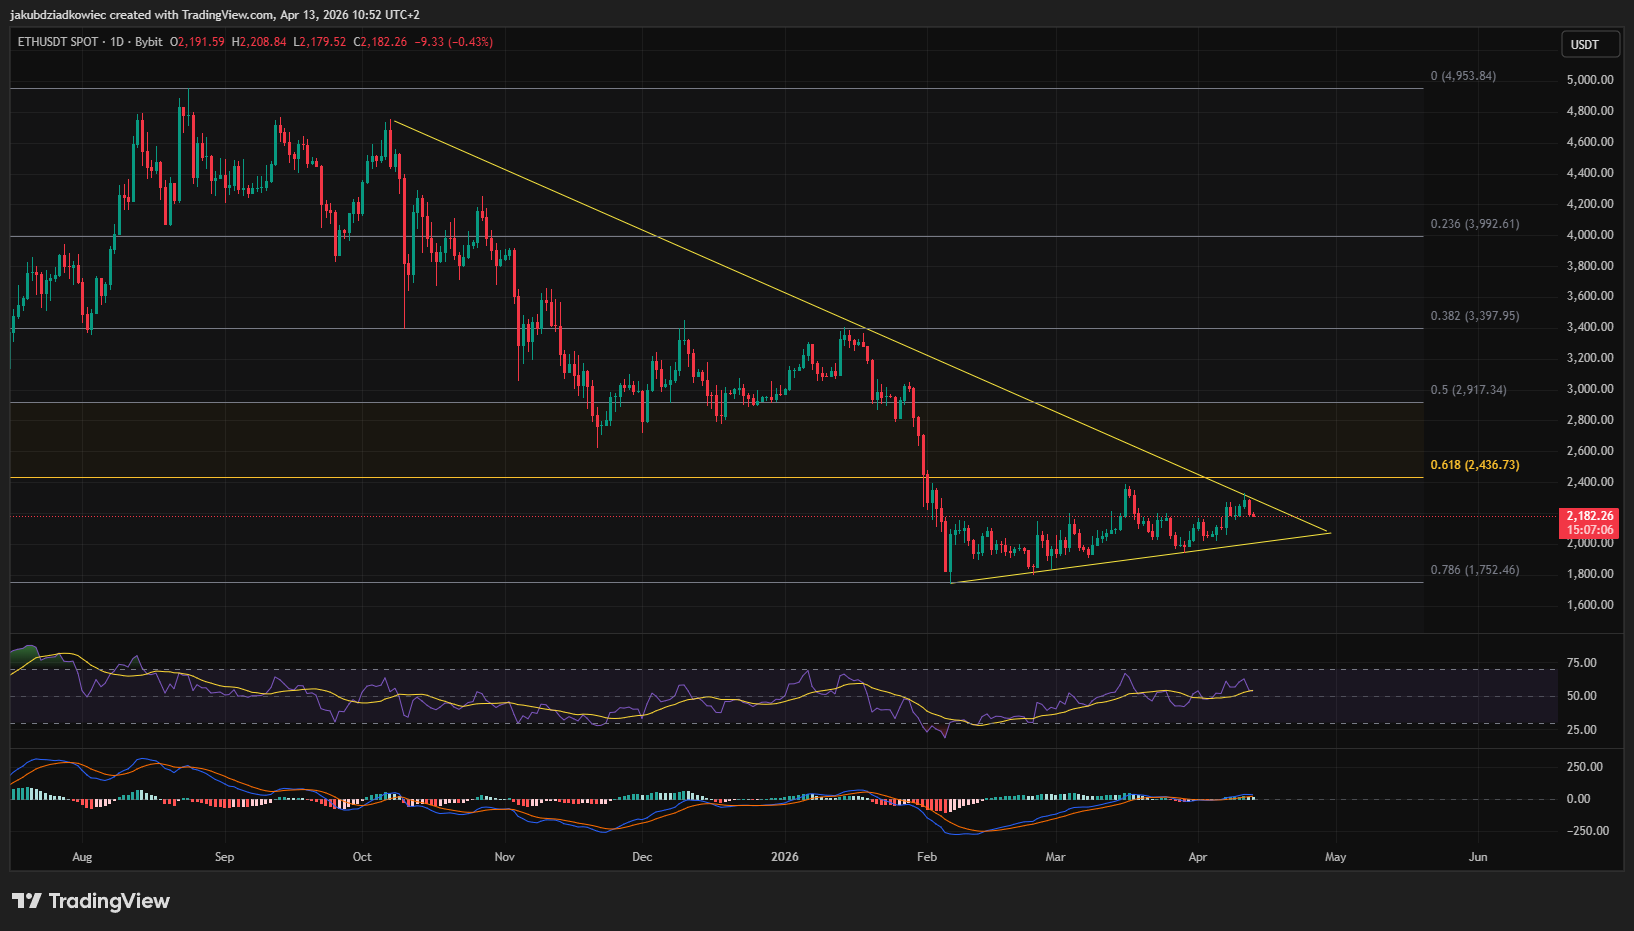
The Fibonacci retracement levels shown here aren’t for short-term trading. They’re based on the larger price movement from a low of around $880 in June 2022 to a high of $4,956 in August 2025. This makes certain price levels particularly important: $2,436 (the 0.618 retracement) is a strong resistance level, meaning prices may struggle to go higher, and $1,752 (the 0.786 retracement) is a key support level, potentially preventing further price drops.
Ethereum is currently trading at $2,182, a key price point. It’s positioned between important support and resistance levels, suggesting a period of uncertainty. The Relative Strength Index (RSI) is around 50-55, indicating a balanced market where neither buyers nor sellers are currently dominating.
Calm before the Storm: 4-Hour Chart & BBWP
Looking at a 4-hour chart, a clear pattern emerges: a falling wedge. This pattern highlights two key price levels that have consistently influenced the market. A strong resistance area between $2,300 and $2,400 coincides with a major Fibonacci retracement level (0.618). The price has struggled to break through this level twice – once in mid-March and again in early April 2026.
The price has consistently bounced back from a strong support area between $1,900 and $2,000. This zone has repeatedly stopped prices from falling further, as buyers consistently step in when the price drops to this level. It’s an important area to monitor if the price declines again.
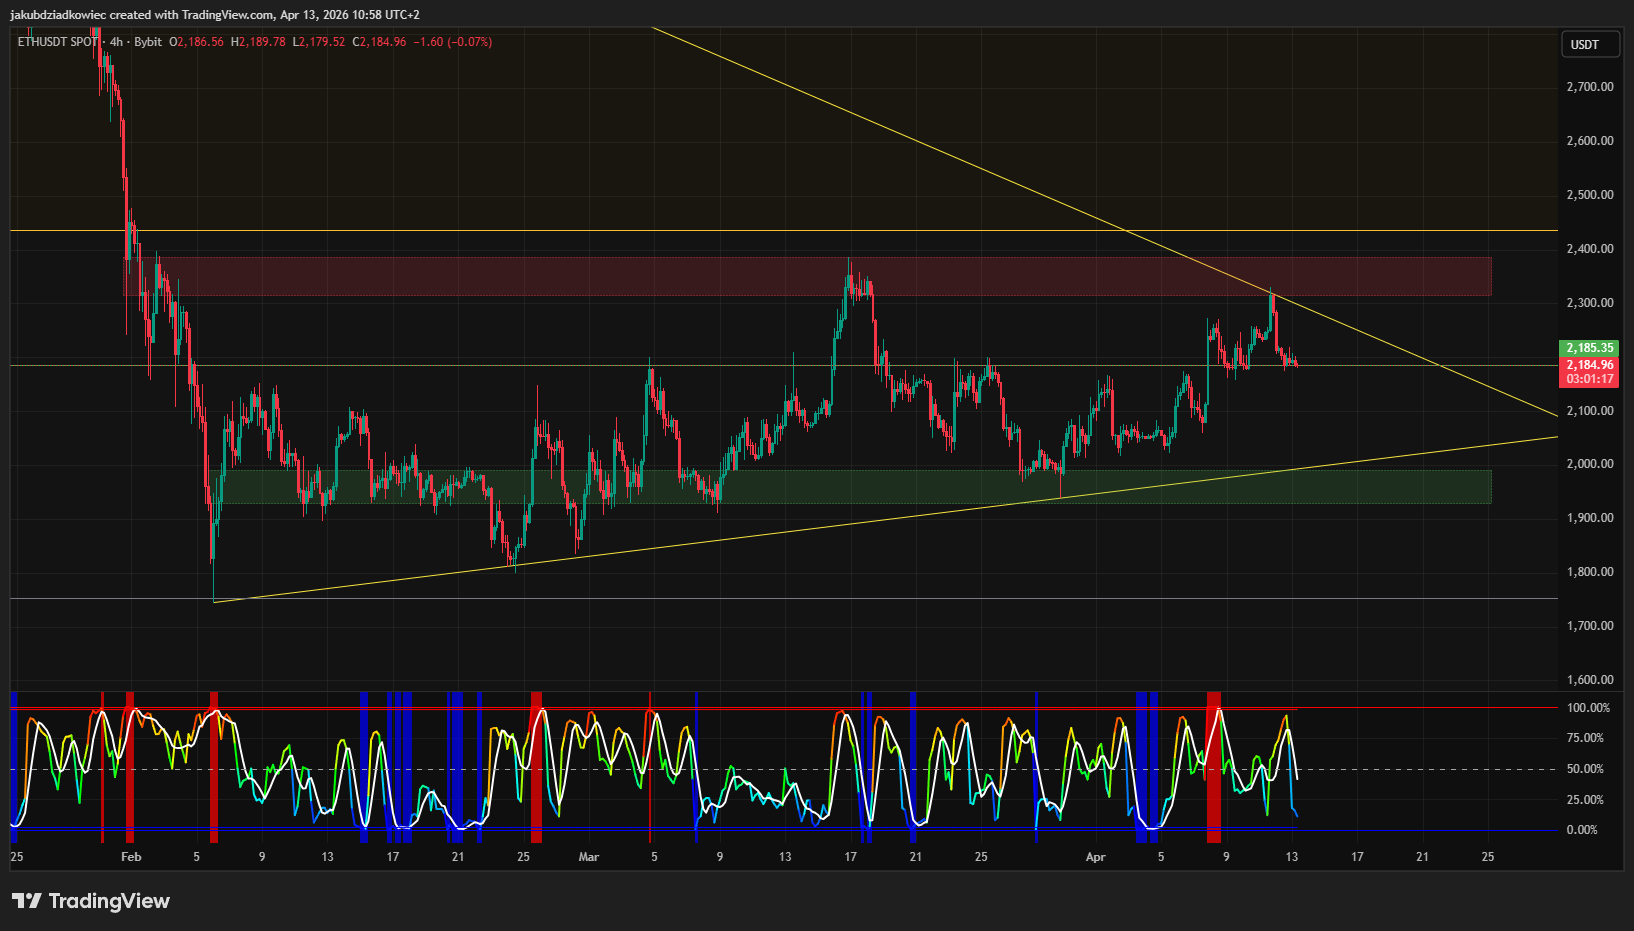
Looking at the 4-hour chart, the Bollinger Band Width Percentile (BBWP) indicator clearly shows how volatility has changed. Each significant price jump – like the drop to $1,750 in February, the rise to $2,380 in March, and the reversal in April – happened when the BBWP was close to 100%. This suggests that these price movements reached their limit and were about to slow down.
The BBWP is currently showing a strong decrease after a peak in April, which suggests that market volatility is declining considerably. Historically, this pattern has often preceded a period of rapid market movement, and with a key point in this pattern approaching in just a few weeks, the timing is particularly noteworthy.
ETH Price Prediction: Bullish & Bearish Scenarios
Bullish Scenario
If the price clearly rises above the upper trendline of the wedge pattern and breaks through the $2,300–$2,436 resistance area, it would suggest buyers are now in charge. This could initially lead to a price increase towards $2,917, and if the upward trend continues, potentially as high as $3,397.
If trading volume (BBWP) increases sharply as the price breaks out, it would suggest this is a real and significant move, not a temporary fake-out. The current chart pattern, a falling wedge, often signals that a downtrend is likely ending and prices are about to rise.
Bearish Scenario
If the price falls below the lower trendline and the $1,900–$2,000 support area, it would suggest sellers are now in control. In that case, the next significant support level to watch would be $1,752. It’s crucial this level holds, as a break below it could lead to further price declines.
If we see a sharp increase in selling pressure (BBWP spike) alongside the current price drop, it would strongly suggest a significant and rapid downturn is happening, likely speeding up the price decrease. If the price falls below $1,752, it could lead to much lower prices and completely negate any previous positive price patterns.
Read More
- Gold Rate Forecast
- ETH PREDICTION. ETH cryptocurrency
- Brent Oil Forecast
- Silver Rate Forecast
- EUR PHP PREDICTION
- Gears A-Turning in Crypto: Trump Kin’s Wild SEI Gamble Unveiled!
- YZi Labs: Predictfun’s the Future (or Why 2026 Will Be Full of Broke People)
- Bitcoin Whales Pull Back: Is a Major Price Move Imminent as BTC Hovers Near $85K?
- TRX EUR PREDICTION. TRX cryptocurrency
- Crypto Listings Fail: Market Dives in Disgrace 🚀💸
2026-04-13 21:01