So, it seems Ethereum has decided to wake up and do something interesting—namely, surge like a caffeinated kangaroo in a field of digital currency. Ethereum (ETH) leaped to $3,050 on Monday, its highest point since February 2. And just to add a bit of drama to the story, this is a solid 120% higher than its pitiful low in April. Here are four charts that help explain why ETH is having its *moment*.
1. Ethereum price forms a golden cross pattern (Yes, you read that right)
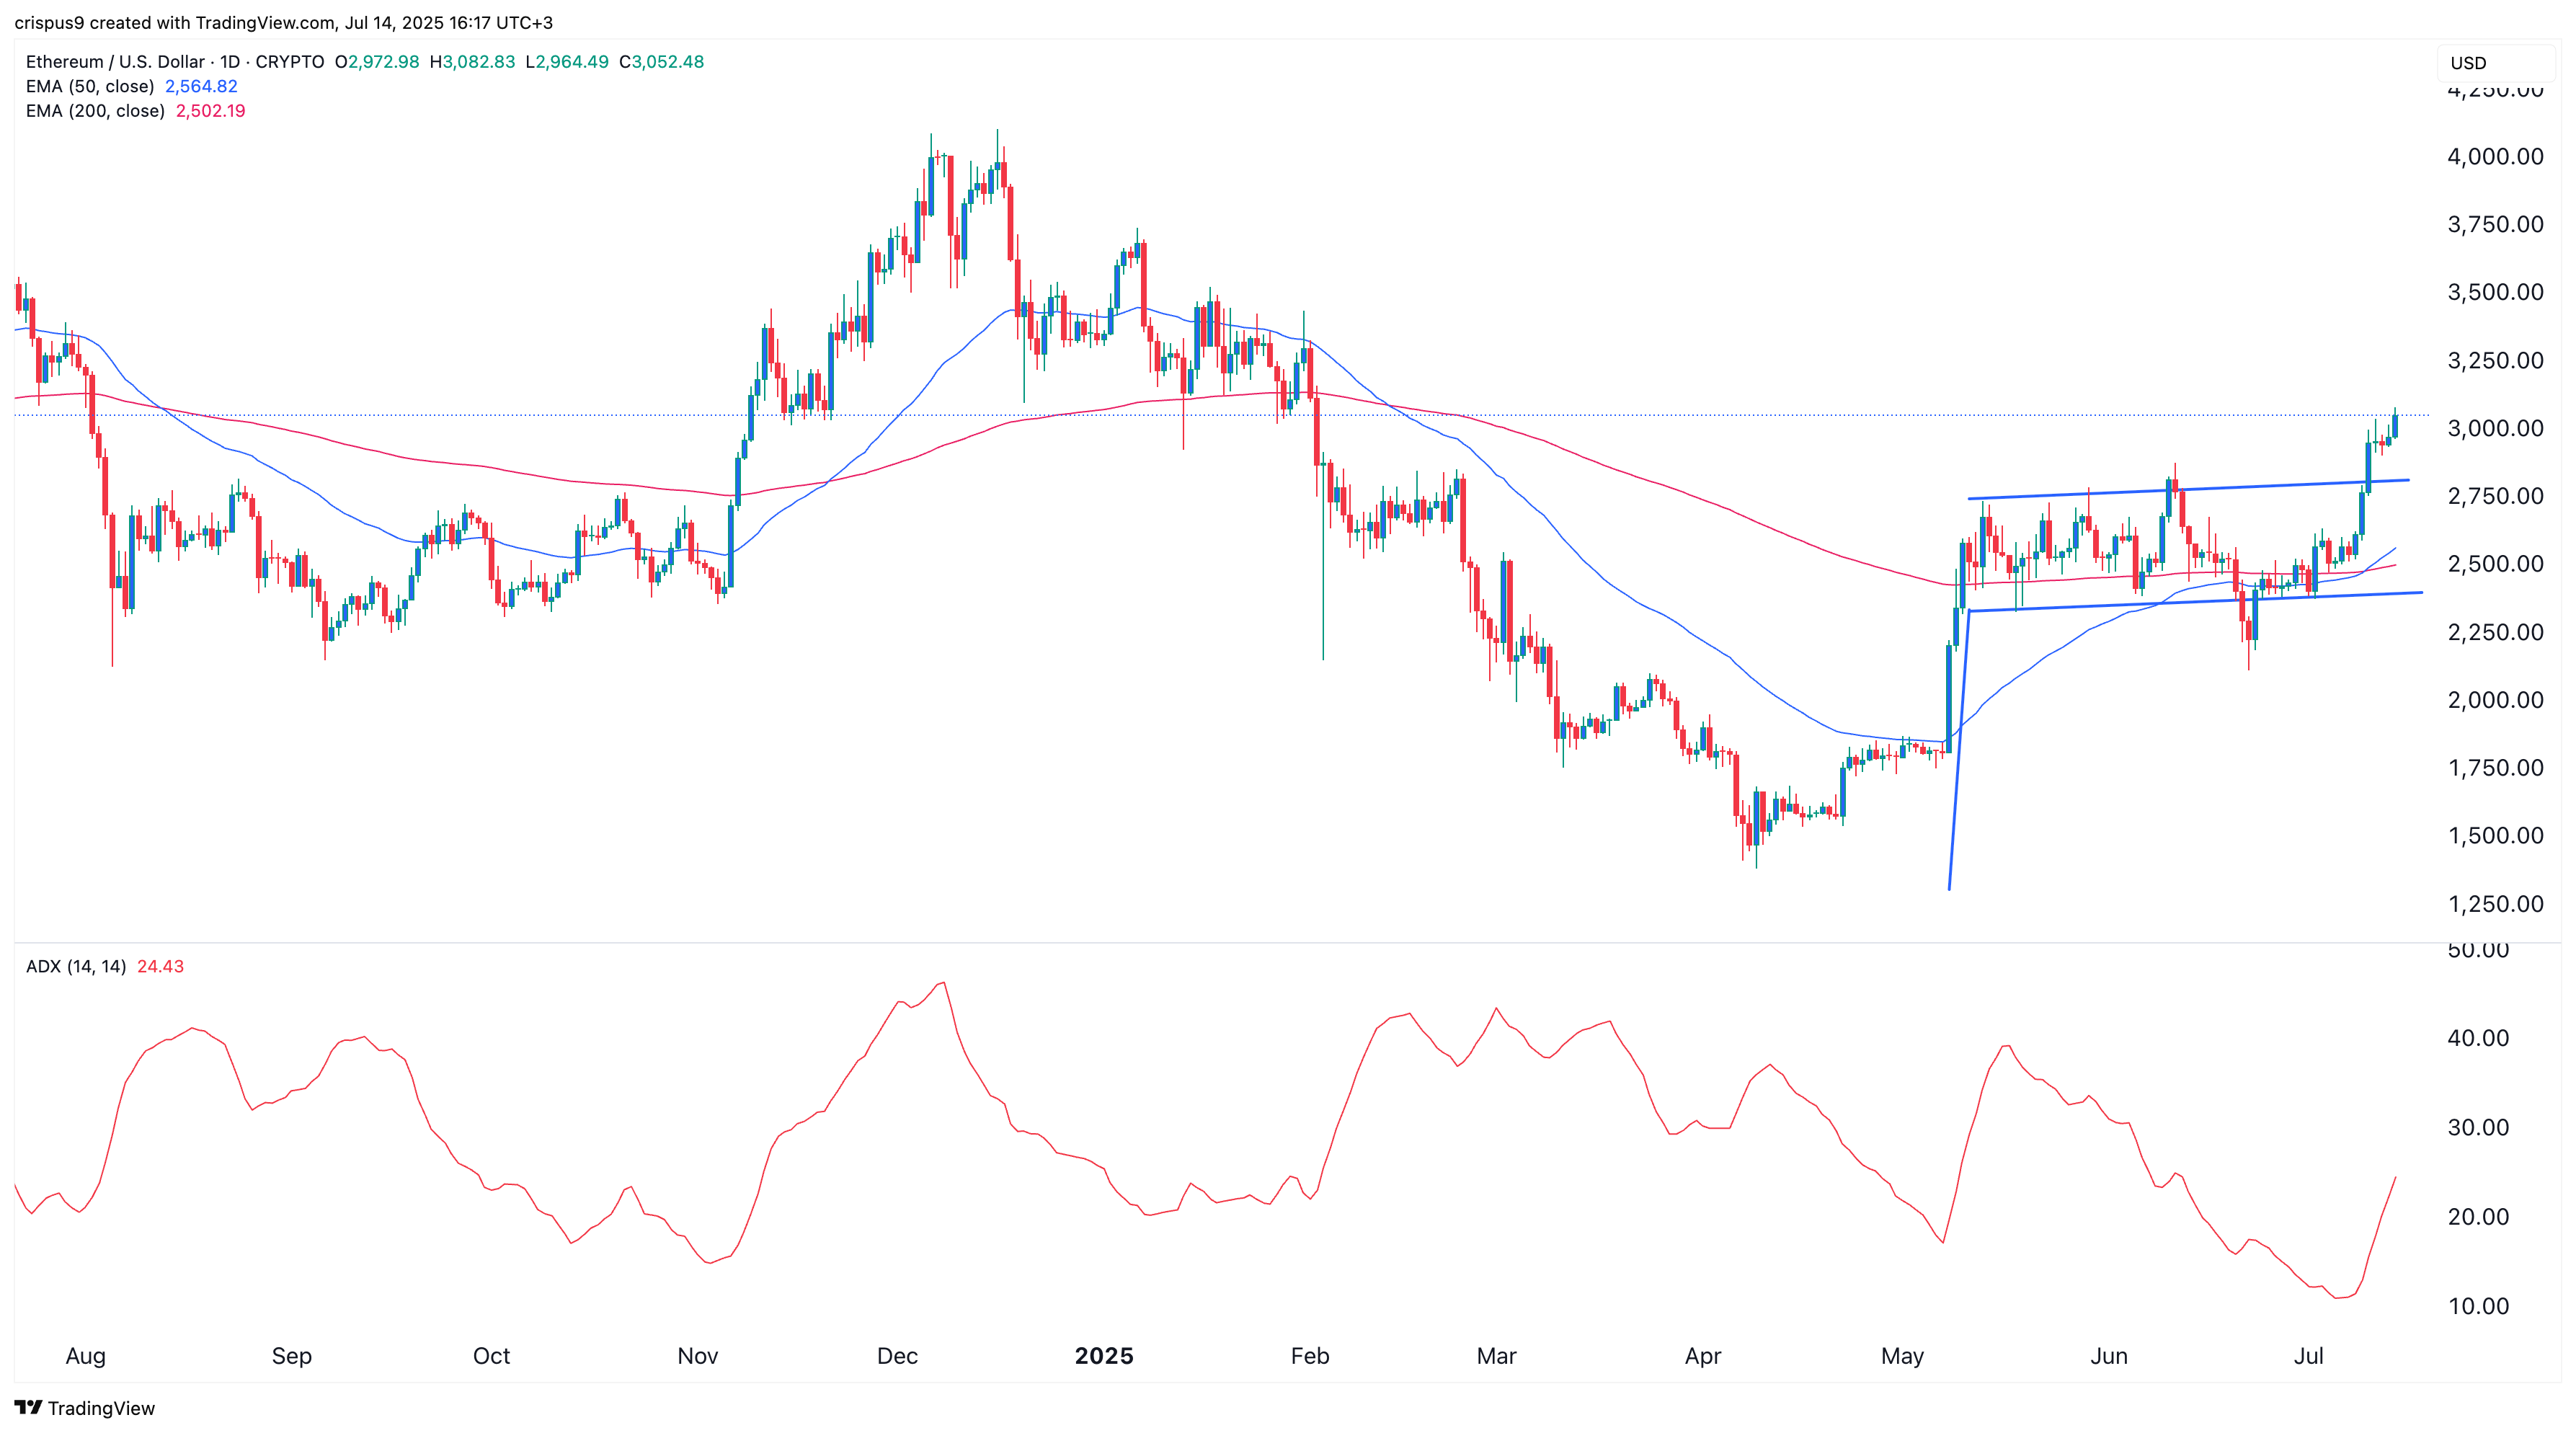
Here’s where things get exciting. The daily chart practically screams “rebound!” ETH has formed a bullish flag pattern, which is a fancy way of saying it looks like a flag of victory fluttering in the wind—if your flag was a cryptographic asset and the wind was a whole lot of buying. Not to mention, ETH has created a golden cross pattern. Yes, that means the 50-day and 200-day Exponential Moving Averages have crossed paths like old friends at a high school reunion. When this happens, it’s considered a highly bullish signal. Look out, $4,000!
2. ETH supply on exchanges is falling (Goodbye, exchange supply!)
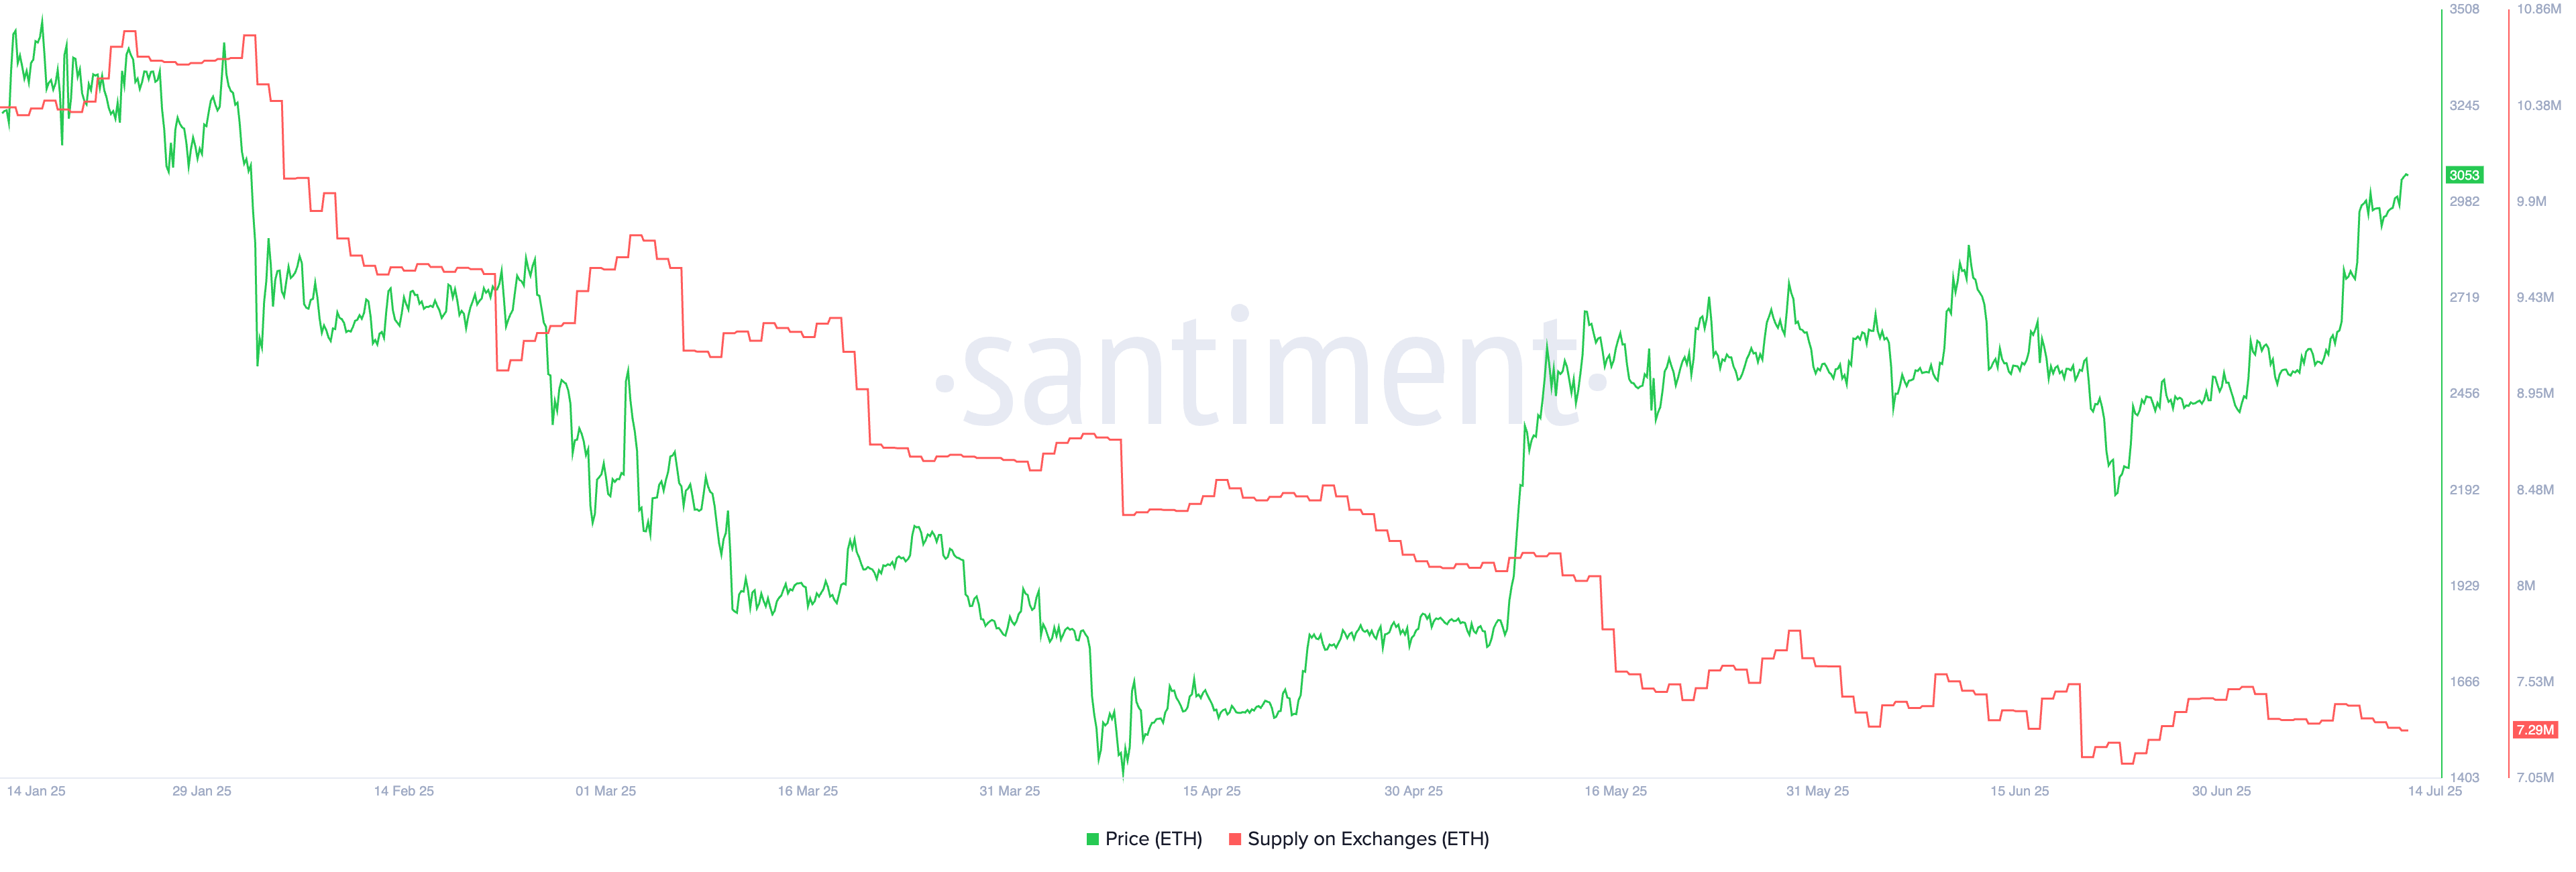
If you take a glance at the chart below, you’ll notice that Ethereum’s supply on exchanges is steadily shrinking. Currently, there are only 7.29 million tokens on exchanges, down from 10.73 million earlier this year. Investors seem to be hoarding their ETH, moving it into self-custody like precious treasure. This move is generally seen as bullish—when people stop selling and start holding, the price often goes up. Go figure!
3. Ethereum whale accumulation (Big fish, big moves)
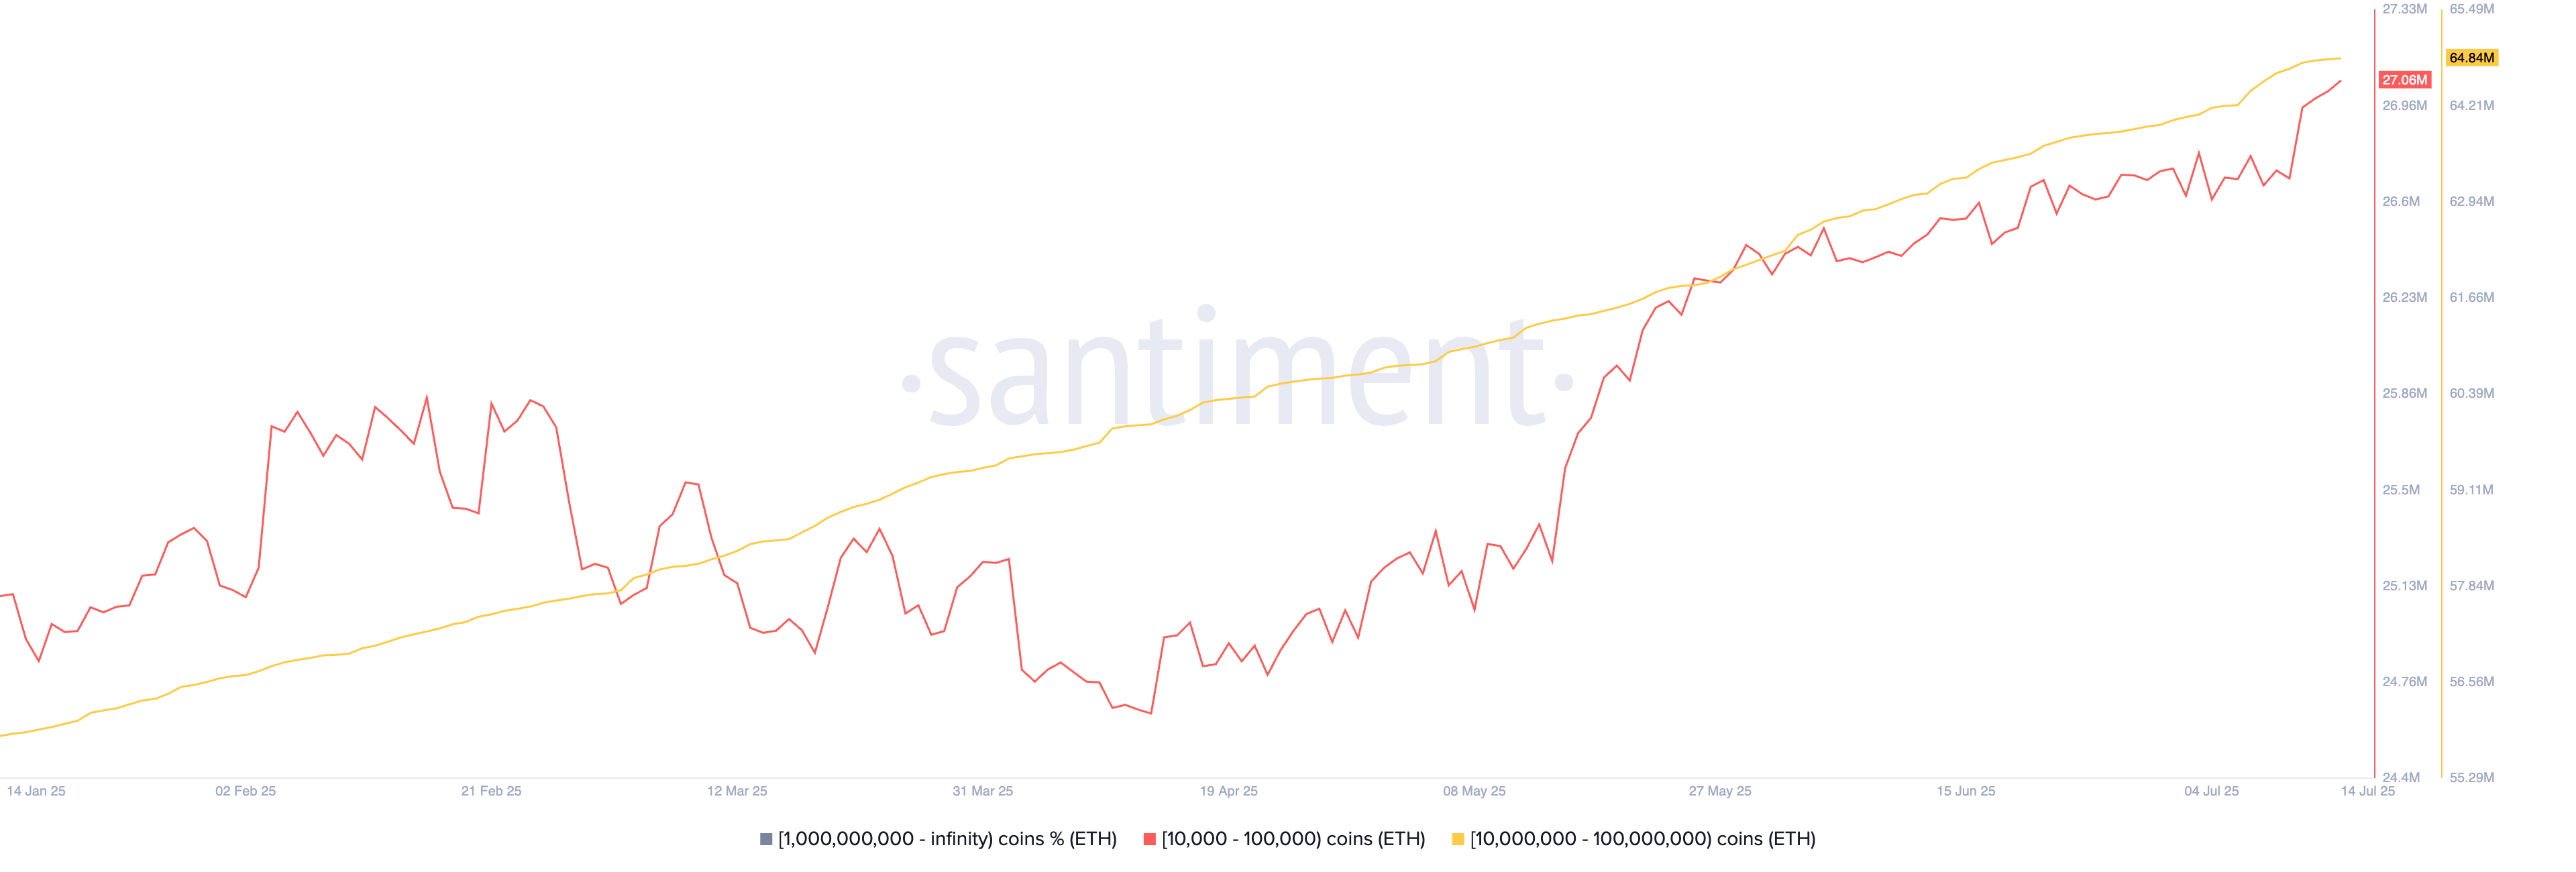
But wait, there’s more! The next chart shows that Ethereum whales—those big, intimidating investors—are continuing to gobble up ETH. Wallets holding between 10,000 and 100,000 ETH have increased their stockpiles, now holding a whopping 27 million coins. If that’s not impressive enough, the wallets holding 10 million to 100 million ETH are sitting on 64 million coins. A word of advice: don’t bet against these folks. Historically, when whales buy, it’s a good sign for the market.
4. Ethereum ETF inflows (Wall Street says, “More, please!”)
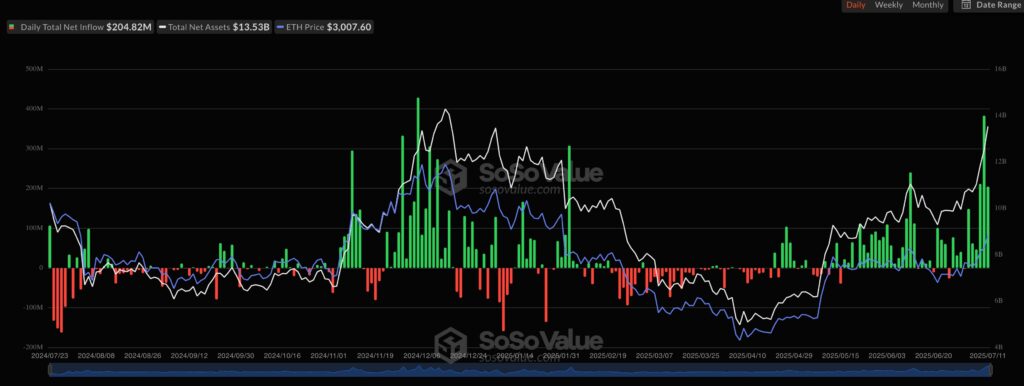
Wall Street is also getting in on the action, with Ethereum ETFs seeing inflows for nine consecutive days. Yes, you heard that right—nine days of “Hey, let’s get more ETH!” The total value of ETH in ETFs is now a cool $13.5 billion, representing 3.7% of the current market cap. Wall Street’s all about that crypto life these days. And when they make moves like this, you can bet your virtual hat that something exciting is happening.
But wait, there’s more. Ethereum’s ongoing rally is supported by several other metrics. For instance, the stablecoin market cap has soared past a record-breaking $127 billion, and the total value locked in DeFi protocols is now over $160 billion. Oh, and let’s not forget Ethereum’s open interest—it’s reached a record $45 billion. All signs point to an Ethereum that’s ready to take over the digital financial world.
Read More
- ETH PREDICTION. ETH cryptocurrency
- Gold Rate Forecast
- Brent Oil Forecast
- Silver Rate Forecast
- Will BNB’s $600 Wall Finally Crumble? Spoiler: The Hodlers Are Plotting 😉
- BlackRock’s ETF: Staking Yields, SEC’s Silence!
- How Tether Spent $5B: Secrets, Tech, and Crypto Shenanigans! 👀💰
- TAO’s 40% Surge: Will AI Make $300 the Next Big Thing?
- Shocking Crypto Stock Moves: Circle Soars, Robinhood Gets Snubbed! 🚀💸
- Ethereum’s ETH: The New Global GDP? 🌍💰
2025-07-14 17:25