Key Highlights
- Bitcoin is idling at about $74,949 (+1.55%), after shoving aside a five-month descending trendline, Ethereum haughtily rose to $2,296 (+1.47%), and XRP clawed back above $1.41 (+1.33%).
- US spot Bitcoin ETFs gulped down $663.91 million in net inflows on April 17, stacking cumulative inflows to $57.74 billion and total net assets to 6.55% of Bitcoin’s grand market cap-so much for modesty.
- CryptoQuant’s sage CryptoOnchain notes Ethereum’s 50-day SMA of the Taker Buy/Sell Ratio on Binance at 1.018-the highest snub to gravity since the last grand reversal.
The market, that fickle magistrate, shifted its countenance this week. Bitcoin, Ethereum, and XRP all broke free from the chains of descending trendlines that had throttled every rally since the late-2025 procession, a spectacle as rare as a winter in July and as convenient as a bureaucrat’s smile on a pension day.
The uproar coincides with a brisk wind of institutional money, as Bitcoin spot ETFs deliver their most generous single-day inflow in weeks and Open Interest in Bitcoin futures climbs about 10% in the last month-clear signs, allegedly, of accumulation rather than a mere bout of short-covering.
BTC reclaims the fort as trendlines shatter and ETF inflows surge
Bitcoin sits near $74,949, up 1.55% on the day, having decisively breached the descending trendline drawn from the November 2025 peak close to $100,000. The price has claimed the 50-day EMA ($71,907) and now presses against the 100-day EMA ($75,278), the most important wicket on the daily chart.
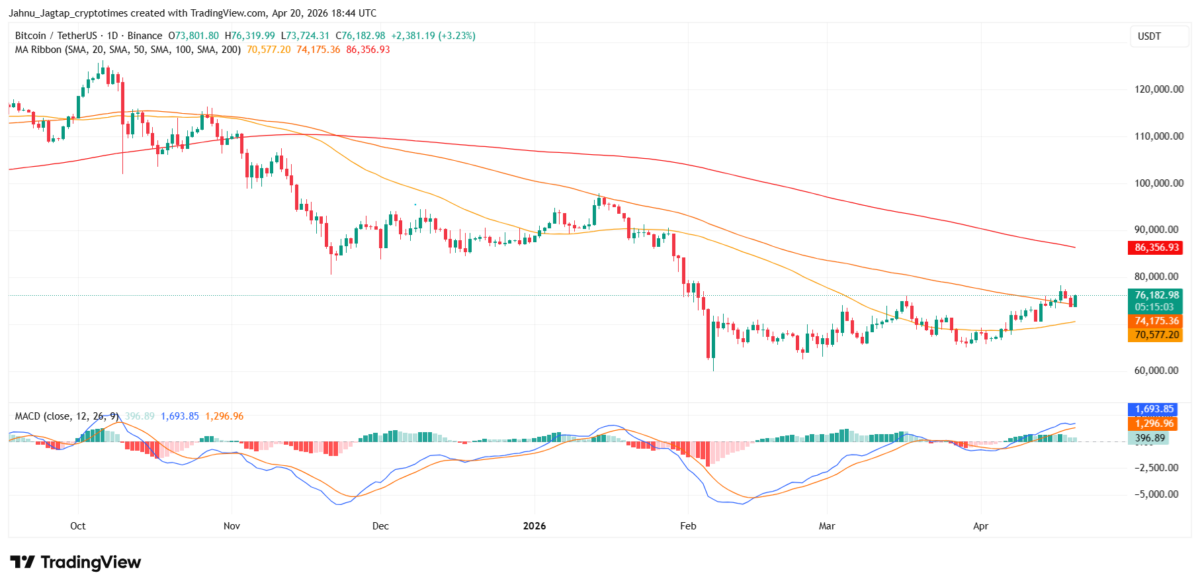
The MACD has performed a bullish crossover and the histogram puffs green at 318.14, while the RSI sits at 58.35-optimistic, yet with room to roam before stepping into overbought territory. The 200-day EMA at $82,816 is the next grand obstacle if the momentum endures.
What the indicators confirm
- MACD: Bullish crossover intact, histogram expanding green → momentum is not fading but collecting its hat and bonnet
- RSI (58.35): Firmly bullish but not tyrannical – plenty of runway left
- EMA stack: 50 EMA curling toward the 100 EMA – a golden cross in the making, if you squint hard enough
Institutional demand is the coal in the furnace. SoSoValue data as of April 17 show US spot Bitcoin ETFs with $663.91 million in net inflows, pushing cumulative inflows to $57.74 billion and total net assets to $101.45 billion, now accounting for 6.55% of Bitcoin’s market cap.
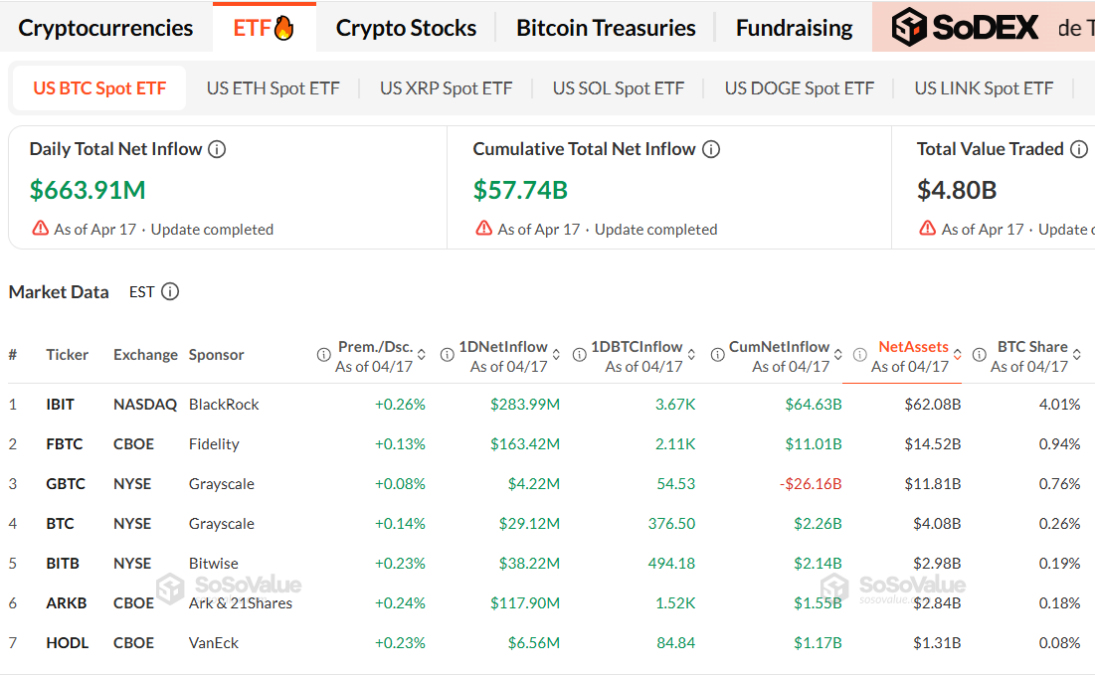
BlackRock’s IBIT led with $283.99 million in single-day inflows and holds $62.08 billion in net assets, commanding a 4.01% slice of circulating BTC. Fidelity’s FBTC followed with $163.42 million, while ARK’s ARKB drew in $117.90 million.
CryptoQuant’s BorisD notes Bitcoin Open Interest has risen roughly 10% in 30 days, with price marching upward for 22 straight days after a lowly base near $60,000 earlier in the year.
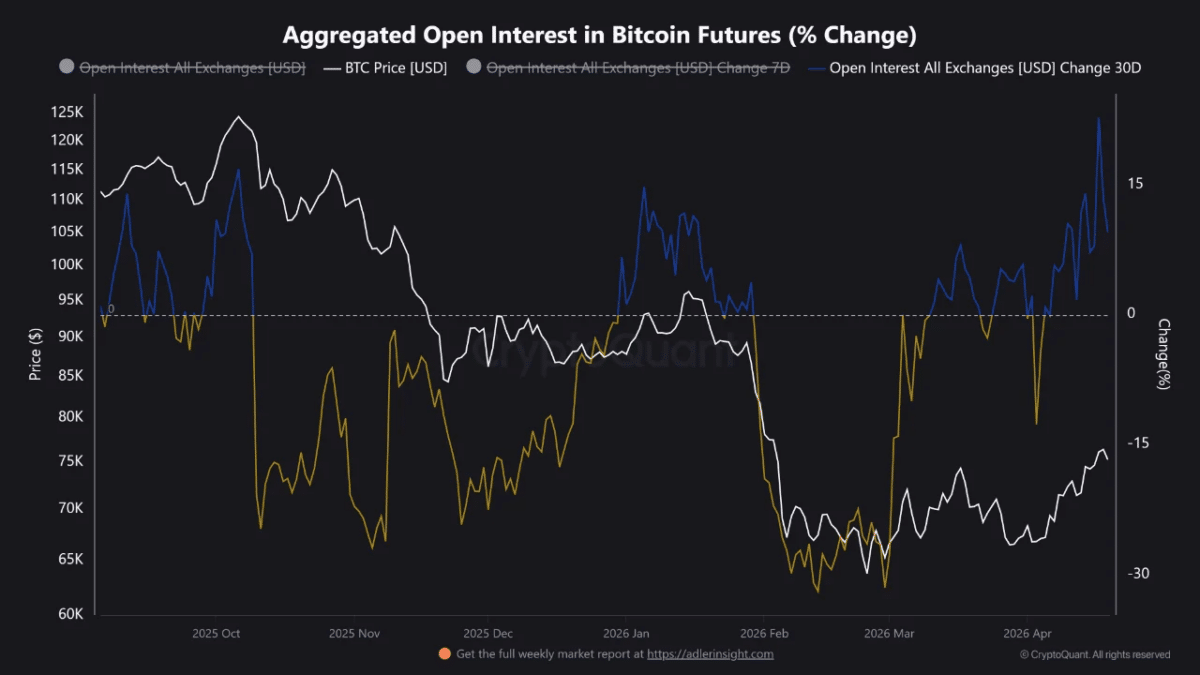
The observer quips that the present setup is “calm on the surface, but underneath, pressure is building fast,” a reminder that this is not a tea party but a performance of position-building rather than exhaustion.
Ethereum breaks the trendline as Binance buying pressure surges to multi-year heights
Ethereum (ETH/USDT) trades at $2,296 (+1.47%), having leapt from the descending line that traced back to the January 2026 apex and reclaiming the 50-day EMA at $2,210. The token now contends with the 100-day EMA at $2,353, a barrier that has rejected every rally since February.
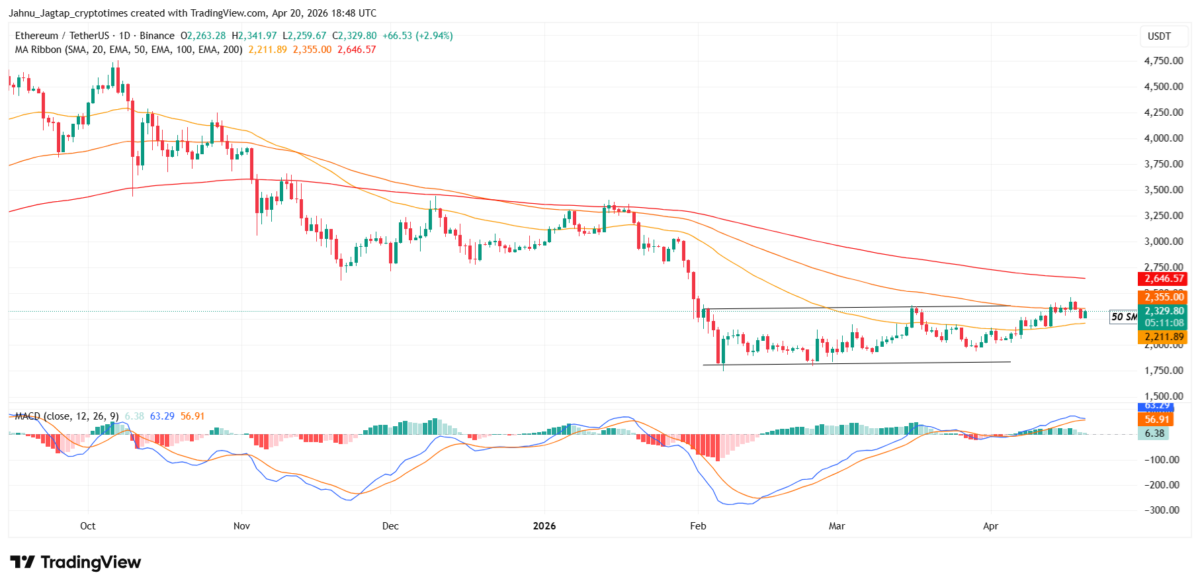
The MACD flipped bullish with the histogram at 4.26, and the RSI at 54.78 sits in neutral-bullish territory. A daily close above $2,353 would confirm the breakout and open the way to the 200-day EMA at $2,628, while failure would return price to a dreary $2,000-$2,200 corridor.
What the indicators confirm
- MACD: Just above zero with a bullish crossover – the momentum reset is complete, the orchestra holding its note
- RSI (54.78): Neutral-bullish, no fever yet
- Key takeaway: The 50 EMA may cross the 100 EMA – a true golden cross is nigh
The on-chain picture endorses the technical setup. CryptoQuant’s CryptoOnchain notes the 50-day Simple Moving Average of Ethereum’s Taker Buy/Sell Ratio on Binance at 1.018, the loftiest reading since the last grand reversal.
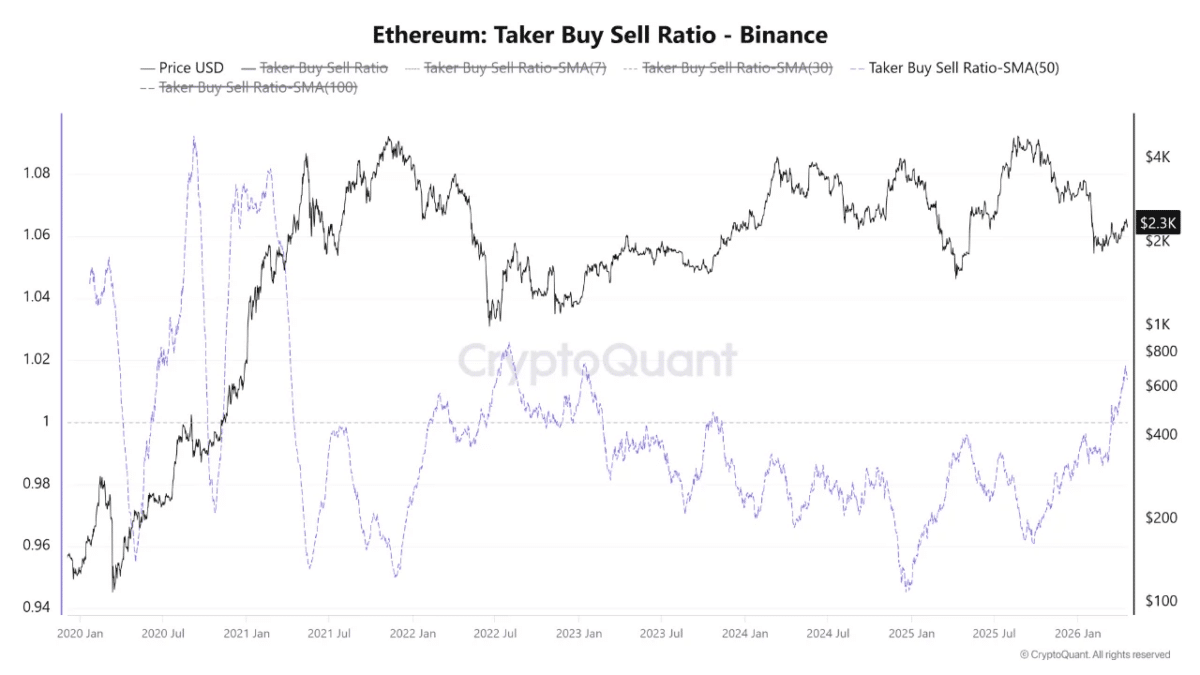
The metric tells us aggressive buyers have outpaced sellers on a 50-day rolling basis, a sentiment shift that typically feasts on the palate of sustained moves.
Spot Ethereum ETFs recorded $127.49 million in net inflows on April 17, with cumulative inflows at $11.94 billion and total net assets at $14.26 billion, representing 4.87% of Ethereum’s market cap.
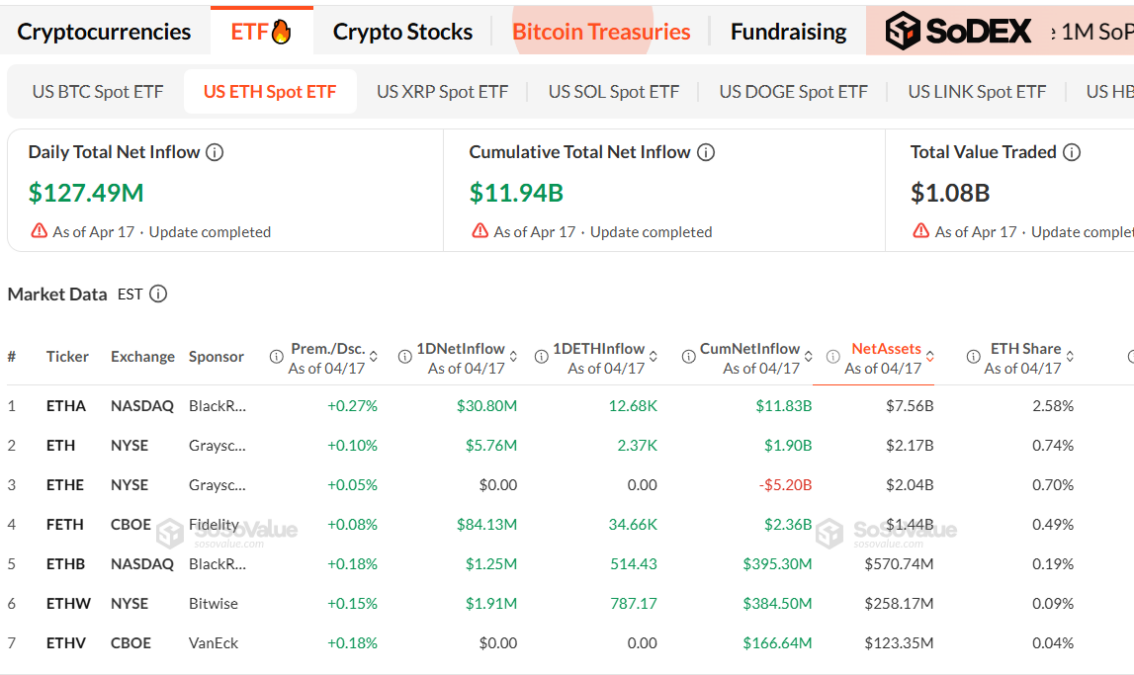
Fidelity’s FETH led with $84.13 million in inflows, followed by BlackRock’s ETHA with $30.80 million. Grayscale’s ETHE saw zero flows, continuing its eternal lament with a cumulative outflow of $5.20 billion since launch.
XRP reclaims the trendline, but exchange reserve divergence sounds a cautious tongue
XRP/USDT sits at $1.4128 (+1.33%), breaking the descending line from the January 2026 apex near $2.40. Price now dwells between the 50-day EMA at $1.41 and the 100-day EMA at $1.54, with the MACD turning bullish and the RSI at 53.94 after a cooling spell.
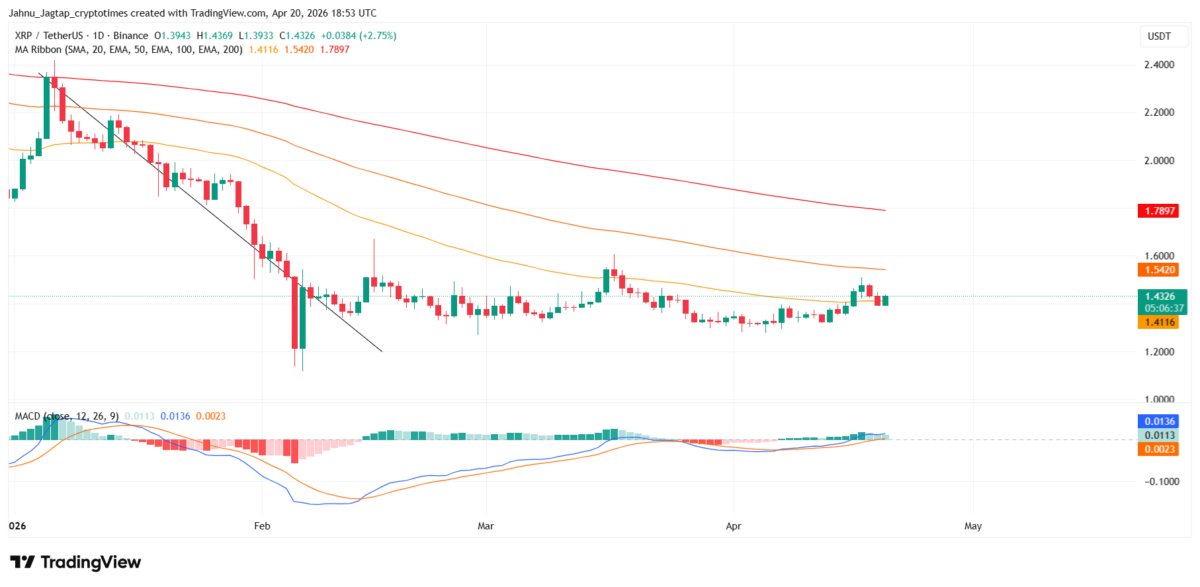
The immediate resistance at $1.54 stands as the hurdle XRP must clear to confirm a broader reversal, while the 200-day EMA at $1.79 looms as the next great target. Support sits near the February low around $1.20, a break of which would sabotage the current base structure.
What the indicators confirm
- MACD: Bullish crossover with histogram turning green
- RSI (53.94): Neutral – cooled from an overbought push, a healthy reset
- Structure: Consolidation tightens directly at the venerable trendline resistance
Yet a cautionary wind blows. CryptoQuant’s PelinayPA warns that XRP exchange reserves on Binance have held steady or crept higher while price drifts lower, breaking a long-standing correlation.
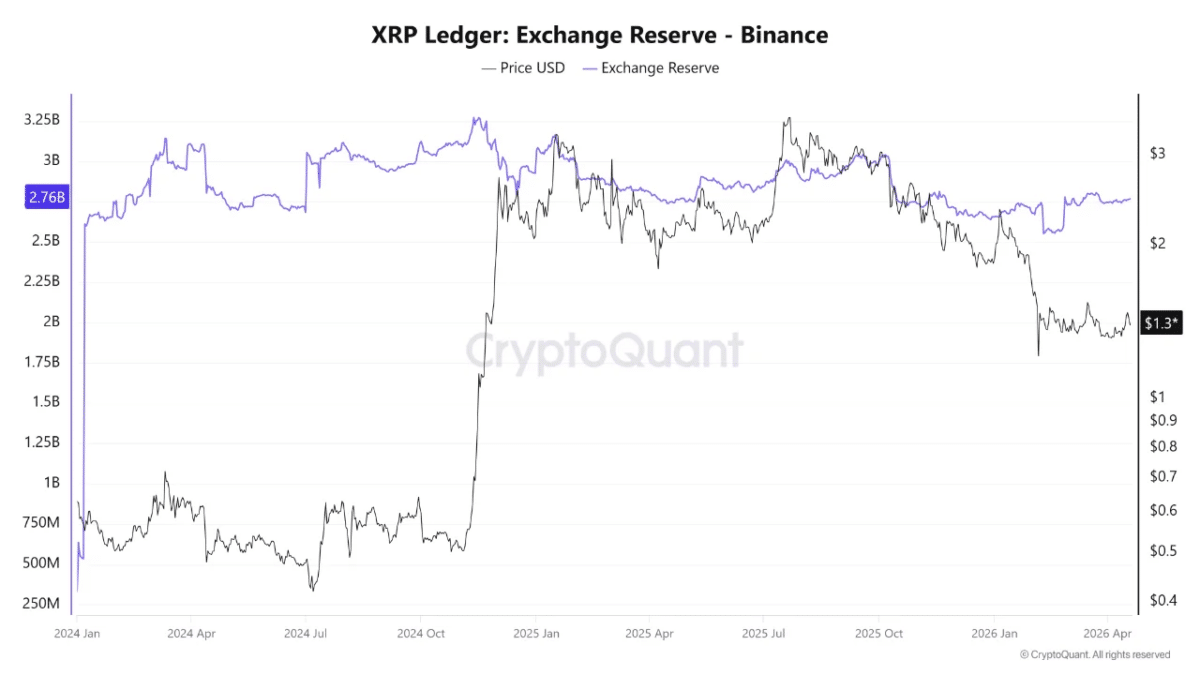
Historically, reserves rising while price softens presage either a flood of supply or a patient accumulation, and the next move will trumpet which fate awaits.
Spot XRP ETF flows reveal a late, almost shy, stage of institutional adoption. Total net assets across US spot XRP ETFs stand at $1.11 billion, just 1.22% of XRP’s market cap, a far cry from Bitcoin’s 6.55% clout.
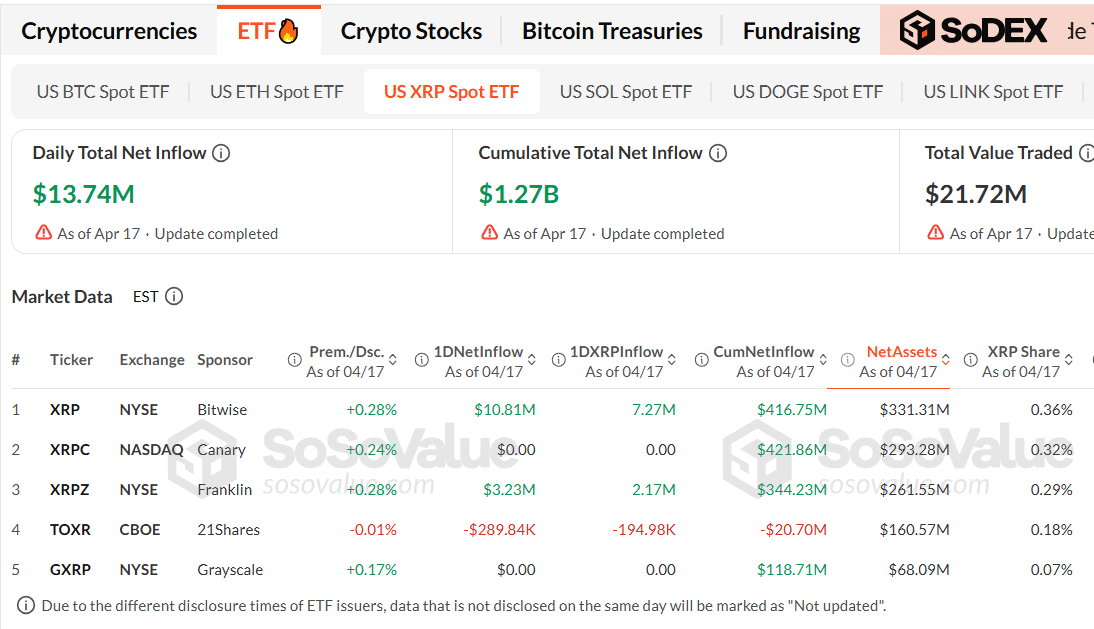
Daily net inflows amounted to $13.74 million on April 17, with cumulative inflows at $1.27 billion. Bitwise’s XRP led with $10.81 million in inflows and $331.31 million in net assets, while Franklin’s XRPZ added $3.23 million. All XRP ETF products were marked “Closed” at snapshot time, as if the market enjoyed a temporary tea-break.
Technical outlook: Three majors, one synchronized setup
What makes this moment uncommonly comic is the near-perfect alignment among BTC, ETH, and XRP. Each has shattered the descending lines from their late-2025 or early-2026 peaks, reclaimed the 50-day EMA, and now contests the 100-day EMA as immediate resistance. The RSI readings on all three sit comfortably in the bullish band (53-58), and the MACD has flipped positive on every chart.
Such confluence of fates among the three titans is rare outside regime-shifting weather. If BTC closes above $75,300, ETH above $2,353, and XRP above $1.54 on a daily basis, the market would herald a structural pivot from the long-downseason of 2026 to a brighter chapter with the potential to wander toward the 200-day EMAs: $82,800 for Bitcoin, $2,628 for Ethereum, and $1.79 for XRP.
What comes next
The coming two weeks promise to be a theater of decisive moments. With ETF inflows roaring, Open Interest climbing, and Ethereum on-chain buying pressure at multi-year highs, the technical and flow pictures align toward the upside for the first time in ages.
A failure at the 100-day EMAs across all three majors would deem this rally a polite prank and send prices back to the February lows. A genuine breakout, however, would declare a structural bottom and open roads to the 200-day EMAs: $82,800 for Bitcoin, $2,628 for Ethereum, and $1.79 for XRP.
As CryptoOnchain’s whispers about Ethereum buying pressure and BorisD’s Open Interest readings suggest, the underfoot flow signals are shifting ahead of price. Until all three majors close above their respective 100-day EMAs on a daily basis, this spectacle remains a promising reversal rather than a confirmed overture.
Read More
- ETH PREDICTION. ETH cryptocurrency
- Gold Rate Forecast
- Altcoins About to Explode? You Won’t Believe What’s Next for These 4 in May 2025 🚀
- Warning: Binance-Listed Siren Token Rallies 30X—Here’s Why You Should Stay Away
- Trump’s Pick for Fed Chair: Kevin Warsh’s Billion-Dollar Crypto & AI Empire
- Bitcoin’s Rally: The Unlikely Hero of the Financial World! 🚀💰
- Brent Oil Forecast
- USD INR PREDICTION
- You Won’t Believe What Happened to Tornado Cash — Crypto Scandal Turns Legal Drama! 🌪️
- Solana’s Wild Ride: Will $82 Become $1,000 Overnight?
2026-04-20 23:03