Ah, Chainlink (LINK), that enigmatic digital coin which seems to have made an art form out of testing the patience of traders everywhere. Despite its best efforts, this asset continues to bump its head against a stubborn descending trendline stretching all the way back from its glorious peak at $52.98-yes, the very same price point where dreams were once born and subsequently crushed. 😩
Analysts, those modern-day soothsayers armed with charts instead of crystal balls, are peering into their screens like fortune-tellers at a carnival. They’re waiting for LINK to either break through the macro resistance at $26.50 or face the humiliation of being rejected yet again, only to slink back down toward $20.25. A successful breach could herald a bullish extravaganza; failure might just send it crawling back to lick its wounds. What drama! 🎭
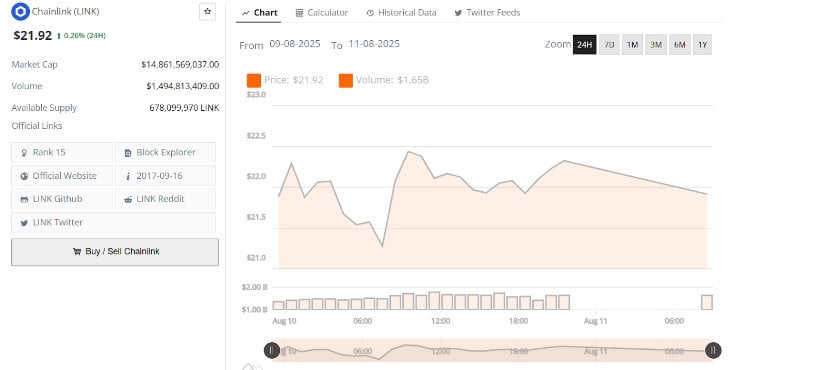
The recent daily chart paints a picture as thrilling as watching paint dry: modest fluctuations, stabilization around $21.92, and low volatility that screams “consolidation.” But wait! There’s hope-a strong weekly bullish candle flickers optimistically on the horizon, whispering promises of higher prices. Perhaps our hero isn’t completely out of tricks after all. 🔥
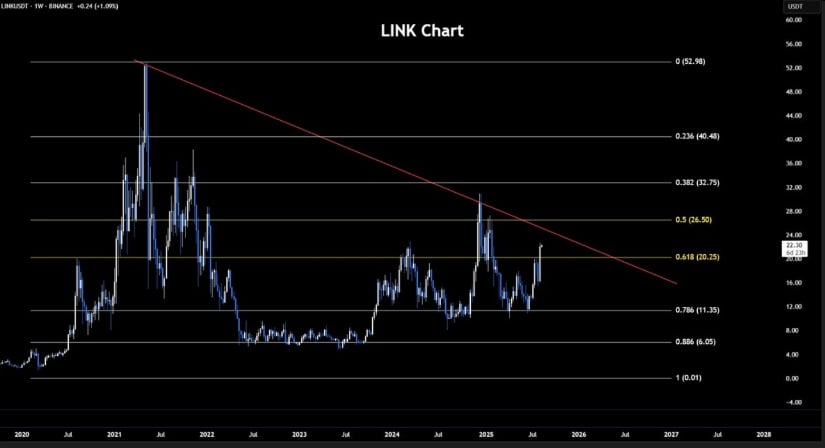
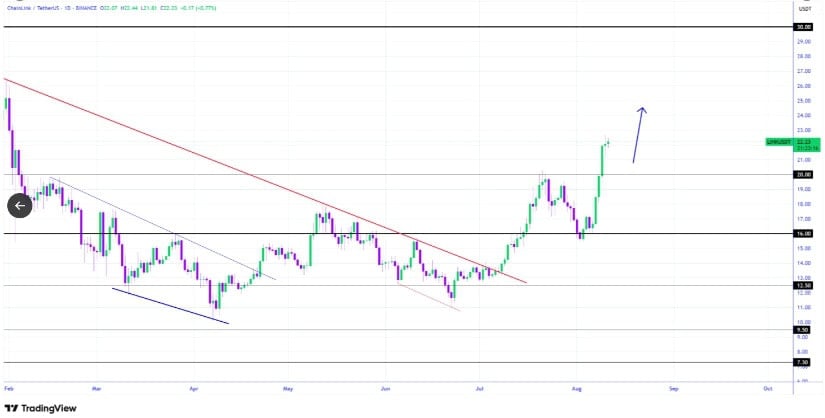
Greeny’s chart, meanwhile, offers a tantalizing glimpse of what could be if LINK finally grows some backbone. Breaking above $26.50 (the 0.5 Fibonacci level) could propel it toward $32.75 and even $40.48. Yet here we are, still stuck under the oppressive shadow of that cursed trendline since 2021. Oh, how the mighty have fallen-or rather, plateaued. 📉
Mixed Sentiment: The Daily Chart’s Identity Crisis
On the daily chart, confusion reigns supreme. CryptoWZRD, a name that sounds more like a Dungeons & Dragons character than a market analyst, notes that while the daily close was indecisive, the bullish weekly candle hints at potential reversal-or is it continuation? Even the charts can’t make up their minds! This divergence creates short-term trading opportunities but leaves long-term prospects dangling precariously in limbo. 🤷♂️
The Art of Doing Nothing
Recent data reveals modest fluctuations, with LINK stabilizing around-you guessed it-$21.92. Market cap hovers near $14.86 billion, and trading volume has reached $1.49 billion. Not exactly earth-shattering news, is it? The slight dip observed on August 10th was promptly followed by stabilization, proving once again that markets love nothing more than sitting on the fence. 🪑
This phase of consolidation feels like watching two boxers circling each other in the ring, neither willing to throw the first punch. Will supply overpower demand, or vice versa? Only time will tell, though one suspects both parties would prefer to take a nap instead. 😴
Market Outlook: Will Chainlink Rise Like a Phoenix or Remain Grounded?
The cryptocurrency world waits with bated breath for LINK to break free from its shackles. Should it conquer the $26.50 resistance zone, brace yourself for fireworks as it charges toward $32.75 and perhaps $40.48. However, without sustained momentum, these dreams may remain mere fantasies. For now, LINK remains trapped within its range, oscillating between hope and despair like a Shakespearean tragedy written in binary code. 🎭
Volume spikes on August 10th suggest traders haven’t entirely given up hope, but whether this leads to triumph or further stagnation remains anyone’s guess. Stay tuned, dear speculators, for the next few days shall reveal all-or perhaps leave us scratching our heads even harder. After all, isn’t that why they call it *crypto*currency? 💸
Read More
- USD HUF PREDICTION
- Gold Rate Forecast
- ETH PREDICTION. ETH cryptocurrency
- Silver Rate Forecast
- Schumer’s Secret Stablecoin Standoff—What They Don’t Want You To Know 🪙🤐
- Brent Oil Forecast
- SEC Suddenly Goes Soft on Crypto? Dragonchain Case Dropped—What Happened?! 🐉💼
- Unmasking the Whale: Ethereum’s Shocking, Witty Crypto Power Move Revealed 😎
- Solana’s Meltdown: $111M Longs Liquidate Like It’s Going Out of Style! 💸🔥
- Ukraine’s Bitcoin Myth: The 46,000 BTC Mirage! 🚀🤡
2025-08-11 16:37