Right, so Bitcoin. May 18, 2025. A cool $103,895. Market cap? Trillions, darling. Trillions. 🙄 And all that frantic trading… nearly 20 billion in a day. You’d think people had something better to do, wouldn’t you?
Bitcoin. Because Why Not? 🤷♀️
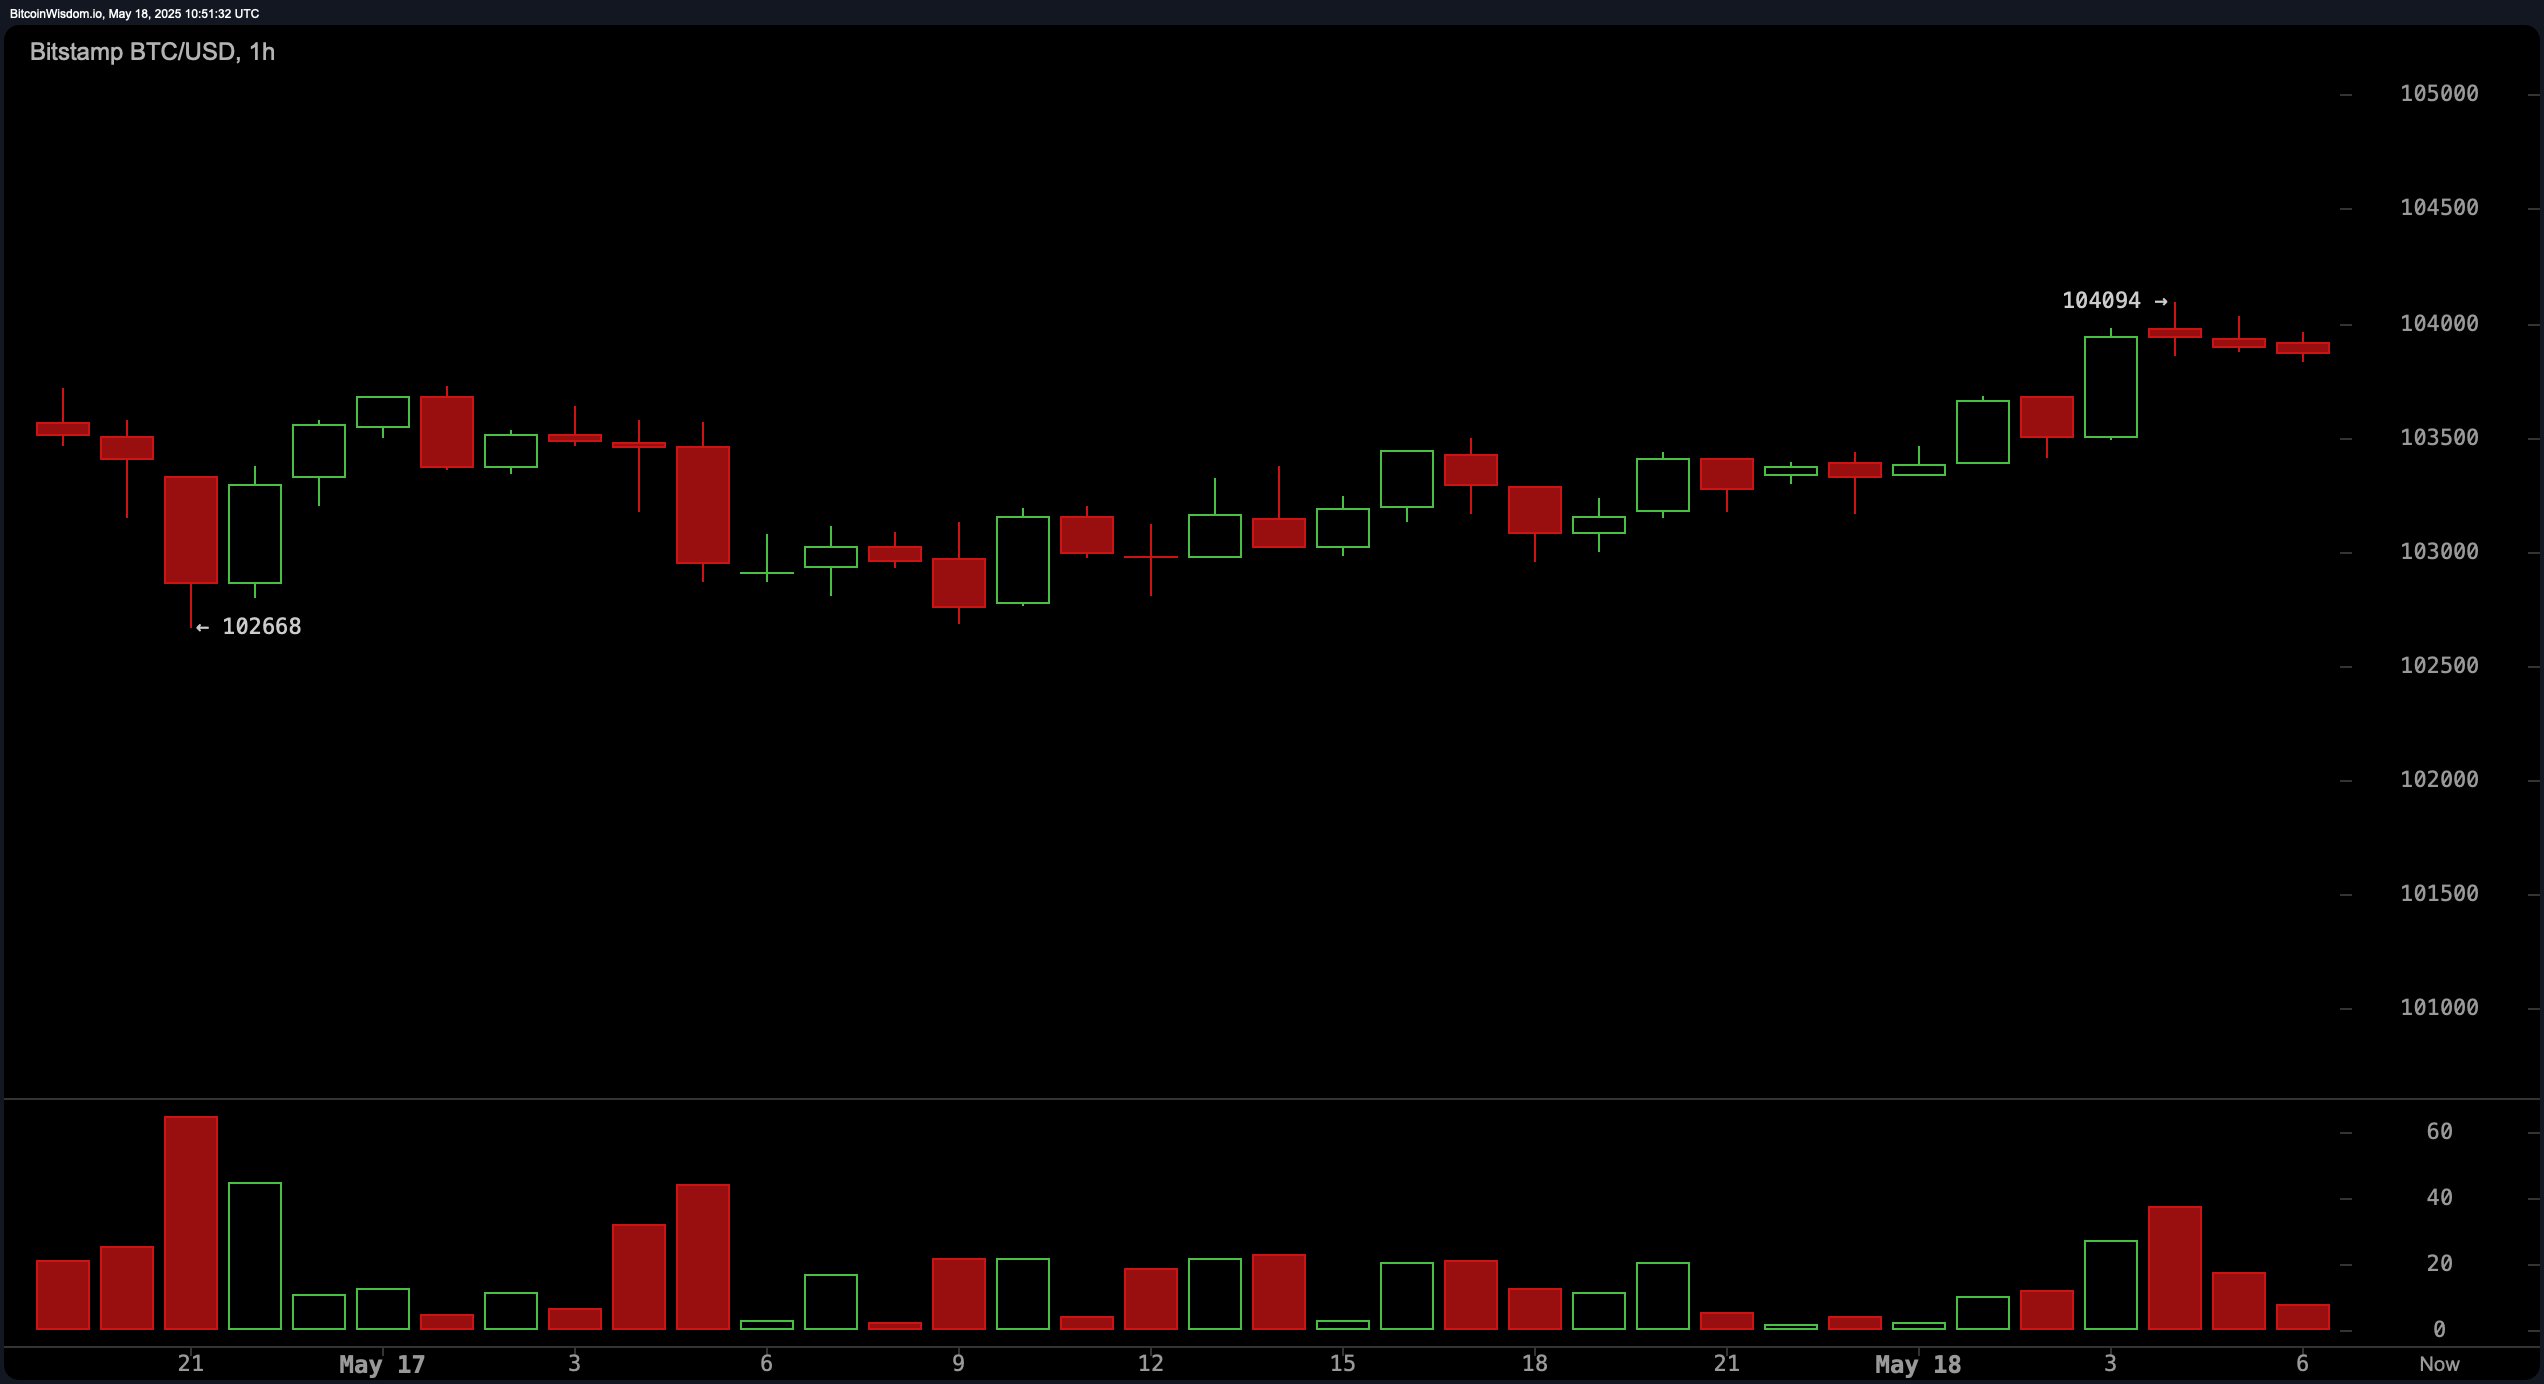
Apparently, it’s been doing this little dance since May 16. Higher lows, higher highs… sounds exhausting. The ‘key resistance’ is $104,094. Honestly, who comes up with these numbers? And support at $102,668. So precise. So… arbitrary. If it bursts past $104,100 with enough oomph, apparently, we’re all in for the long haul. But if it doesn’t? Short-term bearish reversal, darling. Short-term. Don’t panic. Maybe.
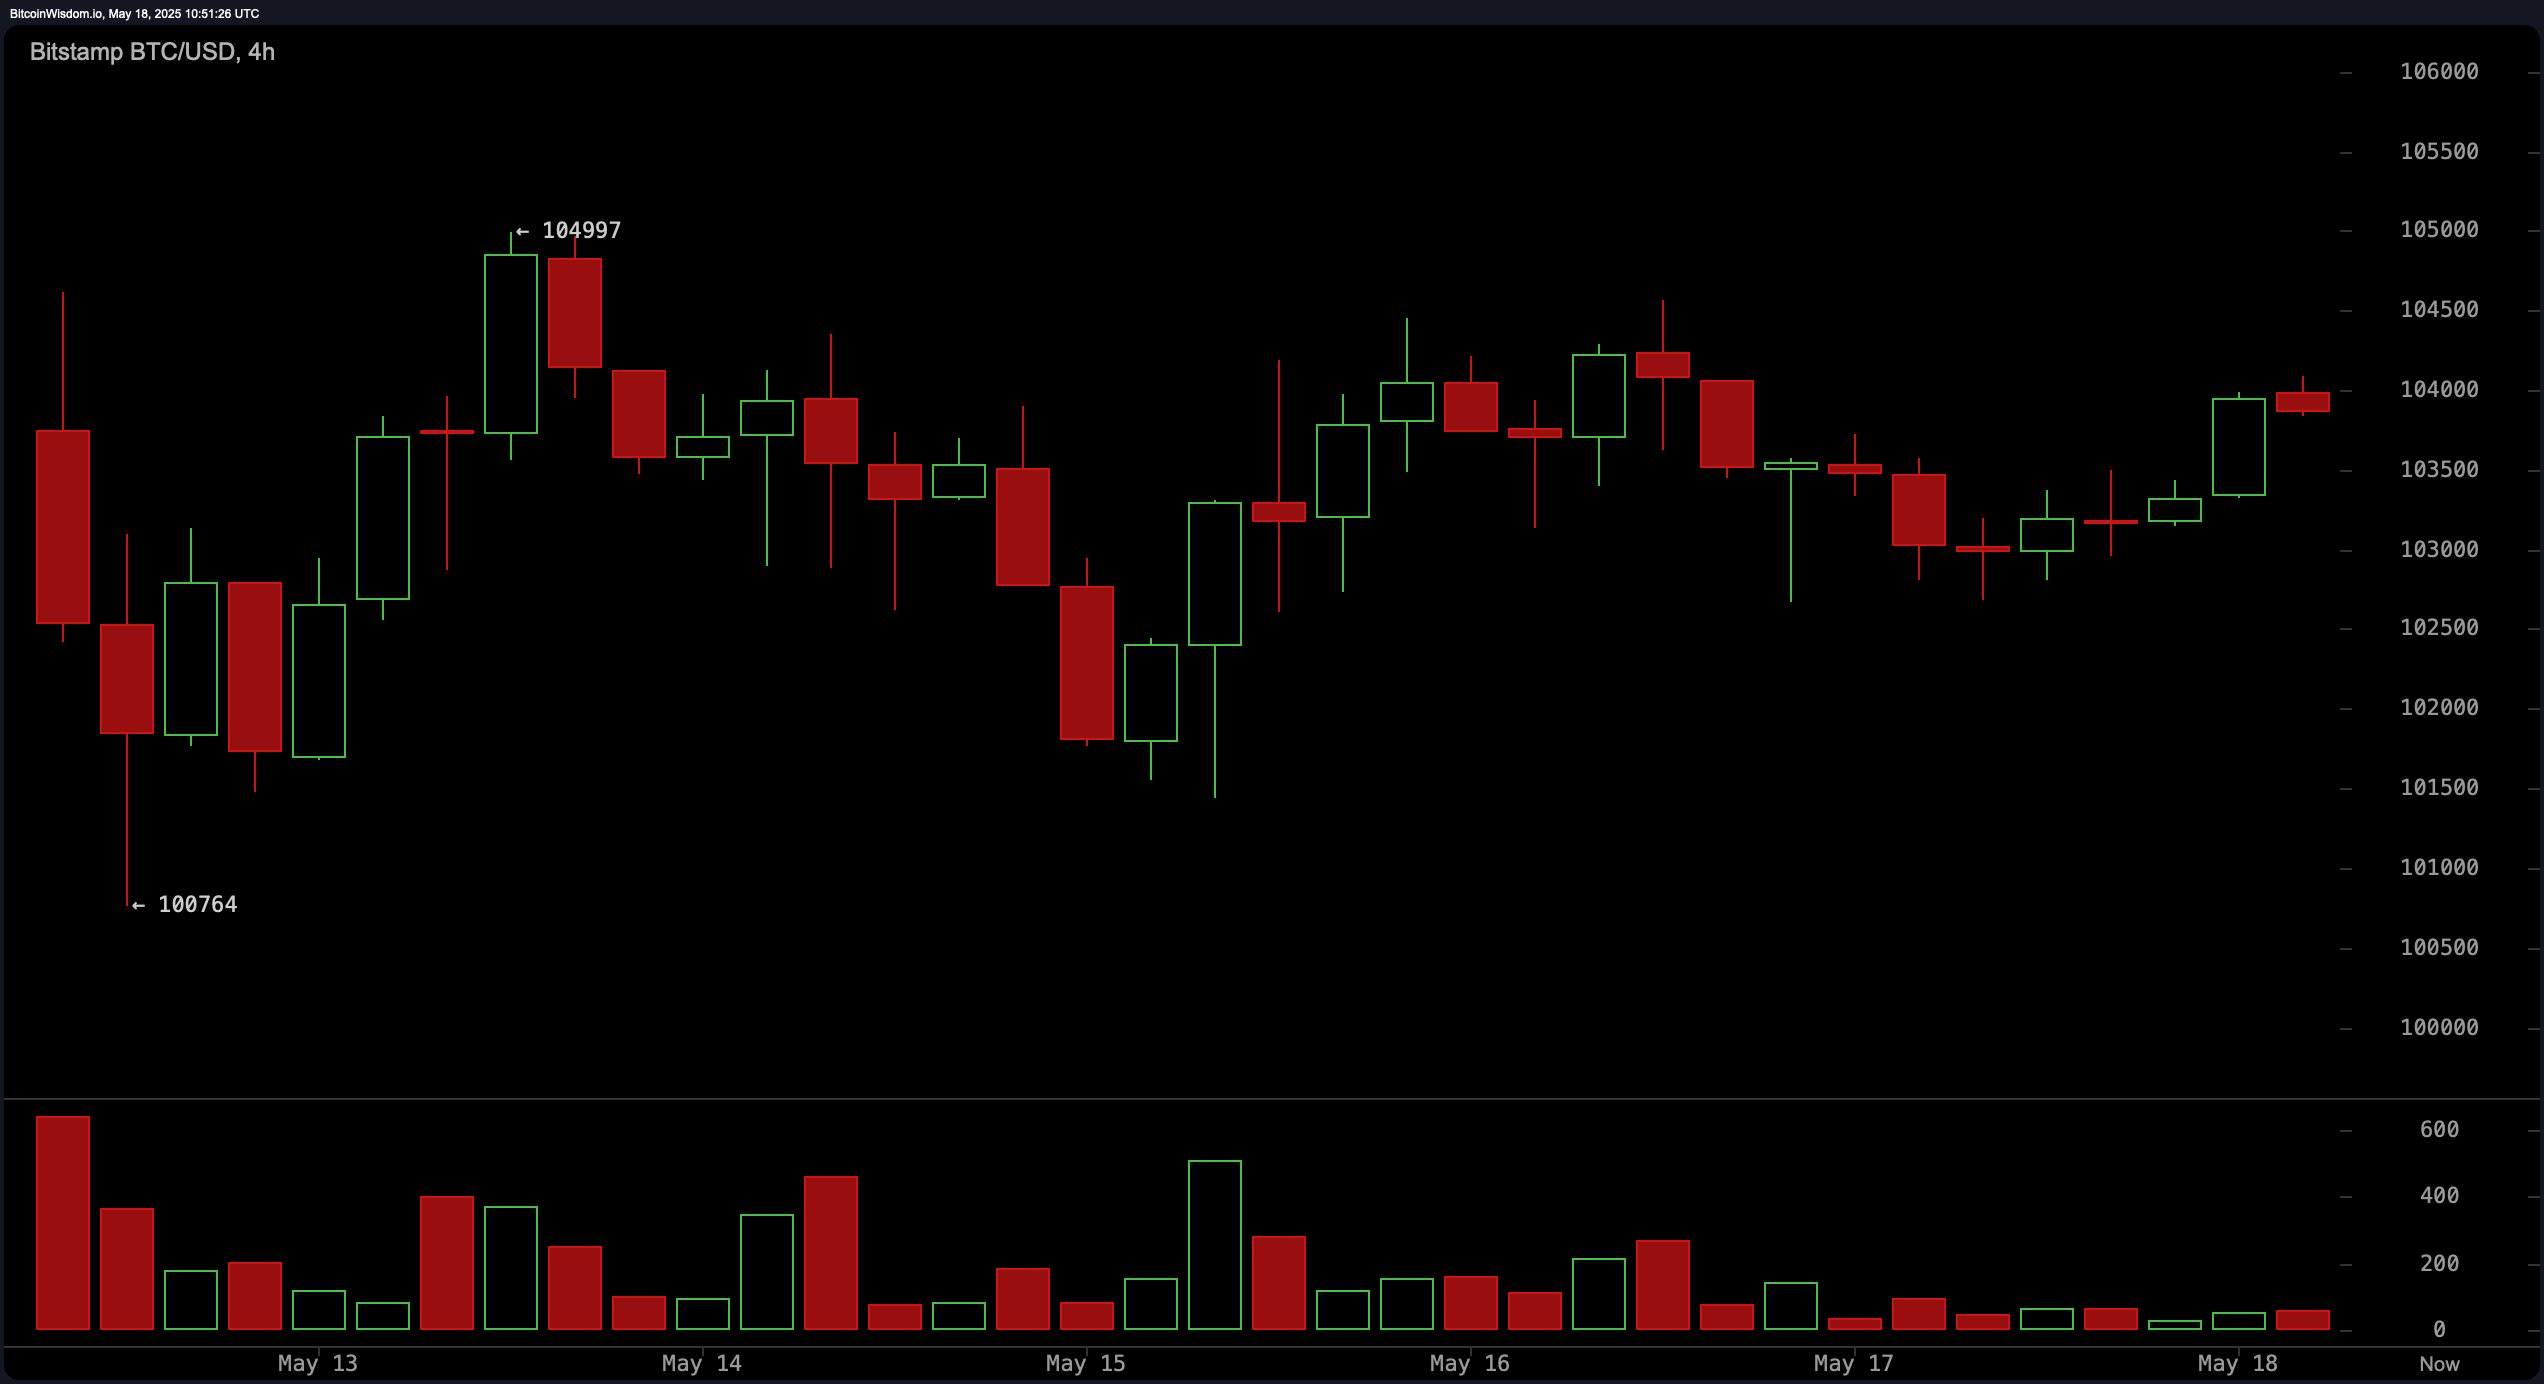
Oh, look, a 4-hour chart. Even more thrilling. Sideways action between $100,764 and $104,997. Failed breakouts? Sounds like my dating life. No clear direction. Just… waiting. Like we haven’t got anything better to do. If it somehow manages to stay above $105,000 with enough *enthusiasm*, we’re back on. Otherwise, a dip towards $100,000. Buckle up, buttercups. 🎢
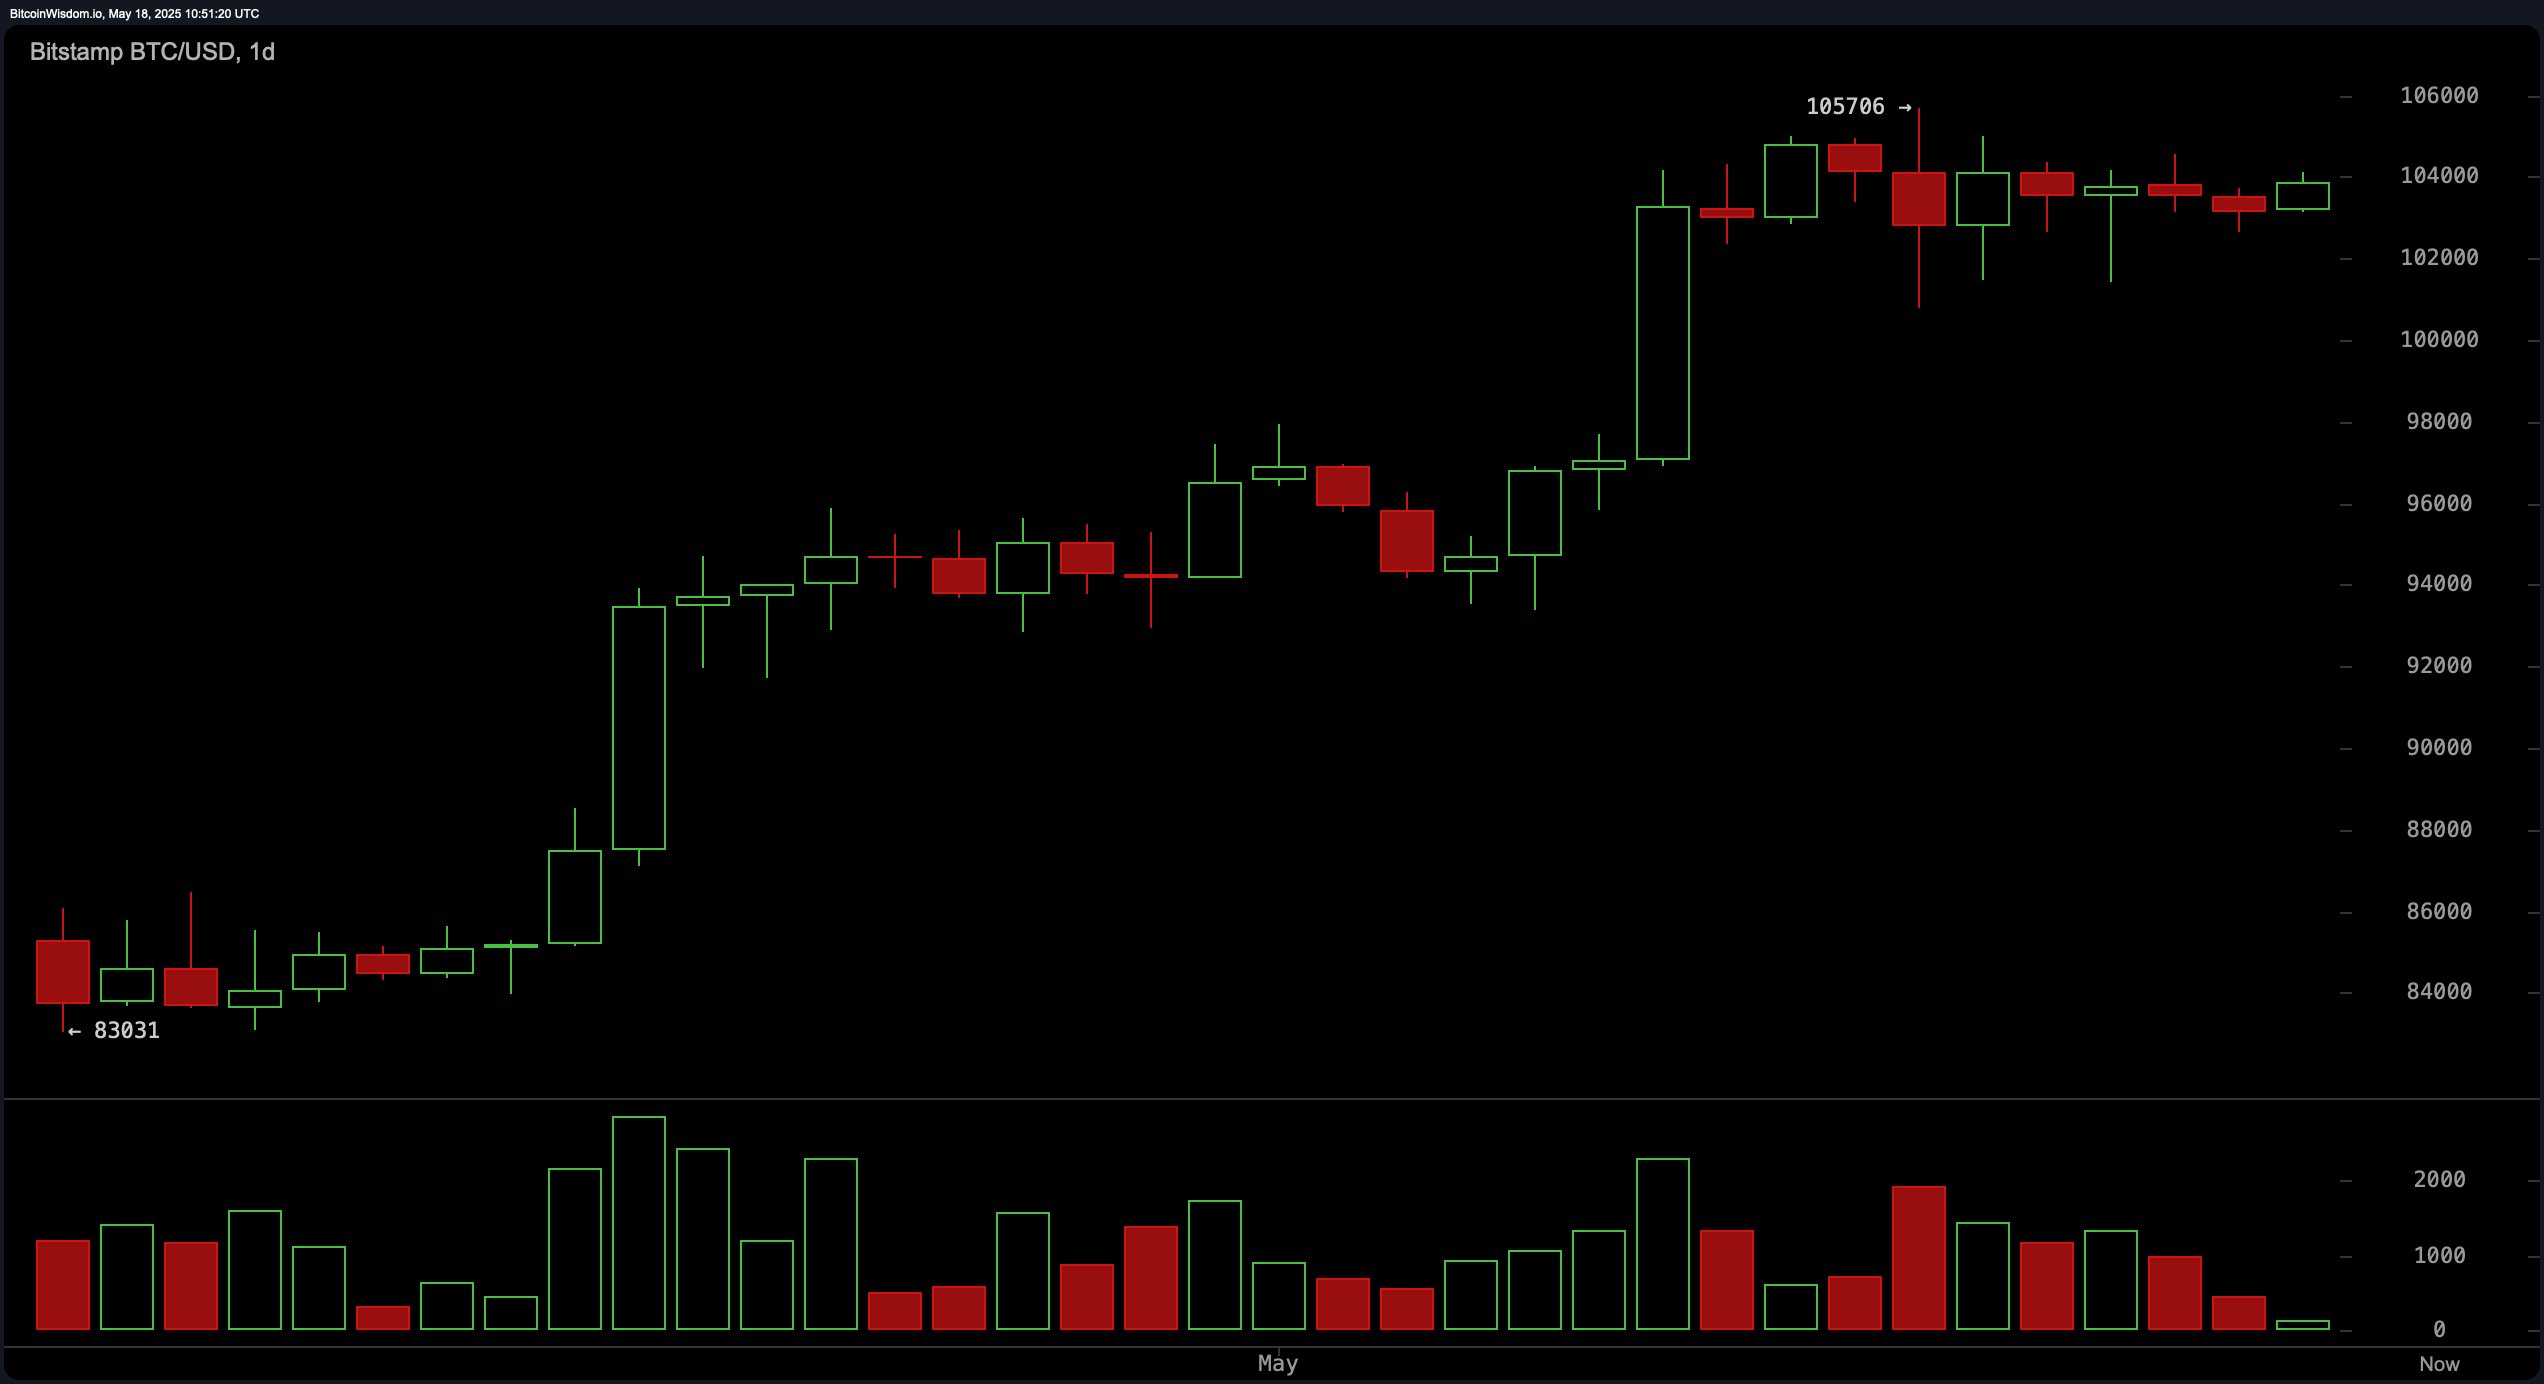
Daily perspective now. Risen from a measly $83,000 in April to a dizzying $105,706. Healthy sideways movement? Near cycle tops? Sounds like my kind of weekend. Volume is down. Could be a breakout, could be… boredom. Above $105,706 with “significant volume”? Bullish. Below $102,000? Deeper retracement. Possibly involving wine. 🍷
Technical indicators. Oh, joy. Oscillators providing “mixed signals.” RSI at 68, Stochastic at 82, CCI at 67. All neutral. As if anything in life is ever truly neutral. The momentum indicator and MACD are flashing sell signals. Short-term vulnerability. Within a *broader* bullish structure. So, basically, no one knows what’s going on. 🎉
Moving averages apparently “reinforce” the upward trend. Key EMAs and SMAs all screaming “buy.” The 10-period EMA at $102,699, the 200-period SMA at $92,624. Below current prices. Which means…? Something good? Maybe? Provided we clear those “key resistance levels.” With conviction. As one does. 💪
Bull Verdict: (Apparently)
Structurally bullish. Strong buy signals. Resilient price base. Consolidation. Breakout above $105,700 would “confirm continuation.” Long positions favored. So, keep throwing money at it. What could possibly go wrong? 💸
Bear Verdict: (Possibly)
Warning signs! Mixed oscillators! Declining volume! Fails to breach $105,000! Breaks below $102,000! Deeper correction! Short setups increasingly viable! Run for the hills! Or, you know, just have another glass of wine. 🤷♀️
Read More
- SPEC PREDICTION. SPEC cryptocurrency
- USD IDR PREDICTION
- Shiba Inu Price Rocket? Giant Token Burn Leaves Traders in Suspense! 🚀🔥
- Pi Network’s $100 Million Initiative Sparks Speculation: What’s Next for Investors?
- USD INR PREDICTION
- Silver Rate Forecast
- EUR BRL PREDICTION
- DOT PREDICTION. DOT cryptocurrency
- Bitcoin Takes a Dramatic Coffee Break While S&P Parties On—What’s Next?
- WLD PREDICTION. WLD cryptocurrency
2025-05-18 14:57