- Bitcoin‘s MVRV ratio flirts with a potentially explosive breakout as futures markets go full throttle.
- A decisive push above $95,783 could set the stage for fireworks, but liquidations could rain on the parade.
Ah, the sweet scent of possibility! Bitcoin’s [BTC] MVRV ratio recently hovered at a tantalizing 2.13, just shy of its 365-day Simple Moving Average (SMA365) of 2.14. Historically, this is where the magic happens—mid-term bullish reversals. But don’t pop the champagne just yet, because Bitcoin needs to confirm a weekly close above that elusive SMA365 for the trend shift to stick.
Yes, my dear market watchers, it’s a tantalizing dance of hope and trepidation as Bitcoin teeters on the edge. A confirmed move above this threshold could herald the dawn of a glorious recovery phase, but anything less would send us back into the jaws of the bears.
Bitcoin – Speculation: Too Much, Too Soon?
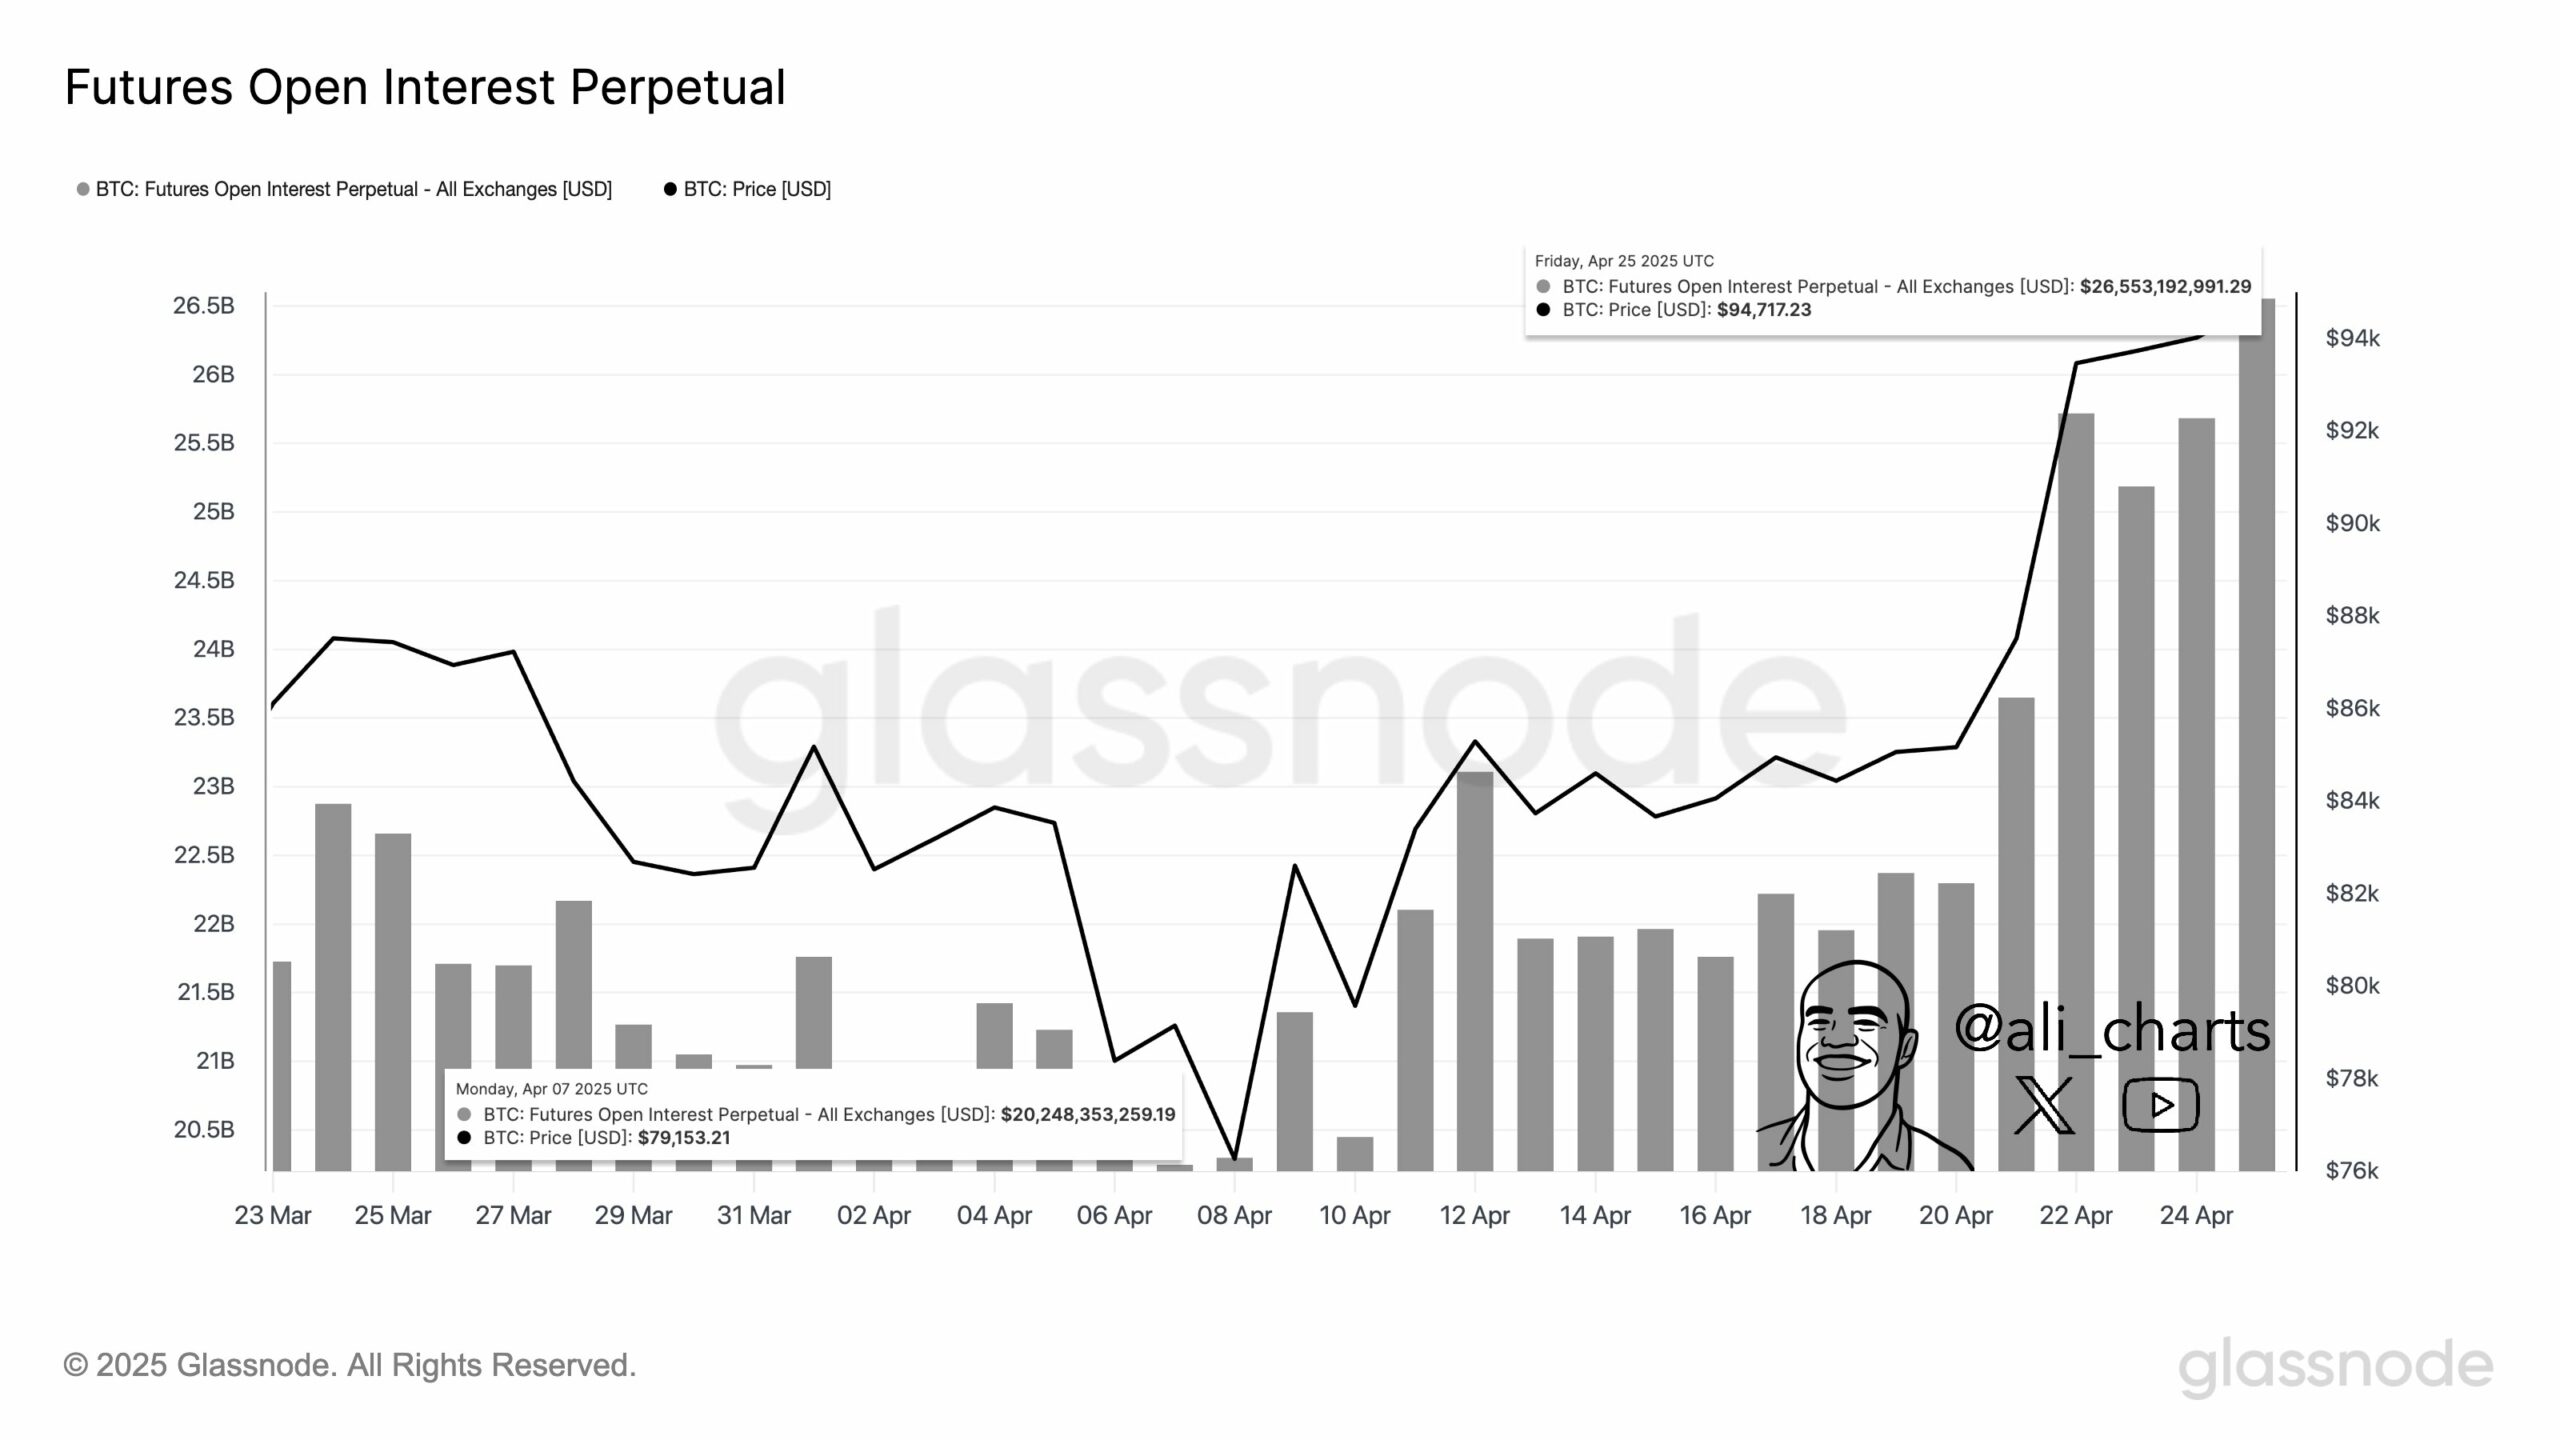
The open interest on Bitcoin futures markets has surged by 20% in the past 20 days, crossing the $26 billion mark. Ah yes, the feverish buildup of speculative positioning—greedy traders have been busy stacking their bets. Meanwhile, the Estimated Leverage Ratio has gone up by 0.99%, showing traders are borrowing like it’s going out of style to amplify their positions. Leverage—always the double-edged sword, isn’t it? It boosts the adrenaline rush of short-term price moves but also opens the door for liquidation chaos if the sentiment turns sour.
BTC Technical Price Structure – Running Out of Steam?
Bitcoin recently broke free from a falling wedge formation—oh, the technical beauty of it all! A classic bullish signal, some might say. But here we are, hovering at $94,036, after a 0.71% slip over the past 24 hours. Sellers are still hanging on to the $95,783 resistance like a dog with a bone. To keep the dream alive, Bitcoin needs to make a clean break above this level. Failure to do so might send us tumbling back to the $83,462 support, where buyers have previously shown some love.

Stock-to-Flow Ratio – Is Scarcity Losing Its Luster?
Oh, the mighty Stock-to-Flow (S2F) ratio—Bitcoin’s beacon of scarcity—has taken a 22.22% dip, adding a bit of short-term pressure on the traditional bullish narrative. But don’t let that send you into a frenzy, folks. This dip doesn’t mean Bitcoin is suddenly going to become as common as a pebble on the beach. Instead, it’s a reminder that immediate price movements are now more sensitive to liquidity trends, leverage dynamics, and the whims of market sentiment.

Liquidation Map Analysis – Where Will Bitcoin Go Next?
According to the liquidation map, Bitcoin finds itself in a dense cluster of long liquidation positions between $93,000 and $94,000—ah, the pressure is building! A sustained dip below these levels could trigger a cascade of liquidations, pushing prices down to $91,000. However, if Bitcoin can conquer the $95,783 resistance, the liquidation pressure eases up, making it smoother sailing for a rapid rise. Can Bitcoin do it? Oh, the suspense!

In conclusion, the fate of Bitcoin hangs in the balance. The rising leverage, the MVRV ratio, and the wedge breakout all suggest a potential bullish continuation—IF, and it’s a big IF, Bitcoin can push through the $95,783 resistance. Otherwise, brace yourselves for another round of wild price swings.
Read More
- Gold Rate Forecast
- Brent Oil Forecast
- USD ZAR PREDICTION
- FET PREDICTION. FET cryptocurrency
- US DOJ Shuts Down Crypto Unit: Who Let the Banter Out? 😎
- Mastercard’s Billion-Dollar Bet: A Fax Machine in a Blockchain World
- ETH PREDICTION. ETH cryptocurrency
- Digital Rebellion: FET’s 50% Rally Shakes the Market!
- Discover the Bizarre Fate of Bitcoin: Fortune or Folly? 😏
- Will XRP Futures Ignite a Financial Fiasco? Analysts Sound the Alarm! 🚨
2025-04-27 14:28