Bitcoin (BTC), in its recent gleeful dance, leaped a modest 6% in the last 24 hours, all thanks to Trump’s declaration of a 90-day tariff pause—oh, but not for China. It’s a mixed bag though, as technical indicators reveal the buyers are jumping in, but the bull is far from ready to gallop.
The DMI points to rising positive pressure, yet there’s a weakening trend lurking in the shadows. Meanwhile, the EMA structure hasn’t quite confirmed a full reversal, leaving us wondering whether we’re on the brink of soaring heights or staring down the barrel of another pullback.
Bitcoin DMI: Buyers In Control, But Not Exactly On Fire
Ah, the Directional Movement Index (DMI). It reveals a shift in momentum—a slow, almost hesitant shift, mind you. The ADX (Average Directional Index) has dropped from a heady 29.56 to a rather flaccid 19.48 in just three days. And with that, the strength of this rally is looking… well, let’s say “questionable.”
For the uninitiated, an ADX above 25 is like a hearty handshake from the market, signaling a strong trend. Below 20? Well, that’s like a limp handshake, or worse, no handshake at all—indicating indecision, at best, or confusion, at worst. With the ADX below 20, it’s safe to assume Bitcoin is either gathering its thoughts or sitting on the fence.
Looking at the bright side—if we must—the +DI (Positive Directional Indicator) has jumped from a lackluster 20.84 to a healthier 28.41, all thanks to Trump’s tariff gift. Ah, such is the beauty of geopolitical tension. But, hold your horses—the -DI (Negative Directional Indicator) has dropped from 29 to 17.89, signaling that the bears are packing their bags… for now.

So, does this mean we’re heading to the moon? Not quite. The +DI surged but then retreated like a guest who stayed at the party a little too long. Momentum? Not exactly in overdrive.
In short: while there’s some buying strength in the air, the drop in ADX and the retreat of +DI say that Bitcoin’s ability to hold a breakout is about as convincing as a politician’s promises.
BTC Ichimoku Cloud: A Hint of Optimism, But Don’t Get Too Excited
Let’s talk Ichimoku Cloud. Don’t worry, it’s not as mystical as it sounds. Bitcoin’s current Cloud setup shows a slightly optimistic but decidedly hesitant chart. The price is just above the red cloud (Kumo), signaling a recent breakout. But hold your applause, for this breakout has all the excitement of a soggy toast.
The cloud ahead is flat, thin, and generally uninspiring. It’s like the market is trying to say, “I’m hopeful, but don’t ask me to do any heavy lifting.” The Leading Span A (green) has tilted slightly upward, but the lack of separation from the flat Span B (red) doesn’t scream “strong bull market.”
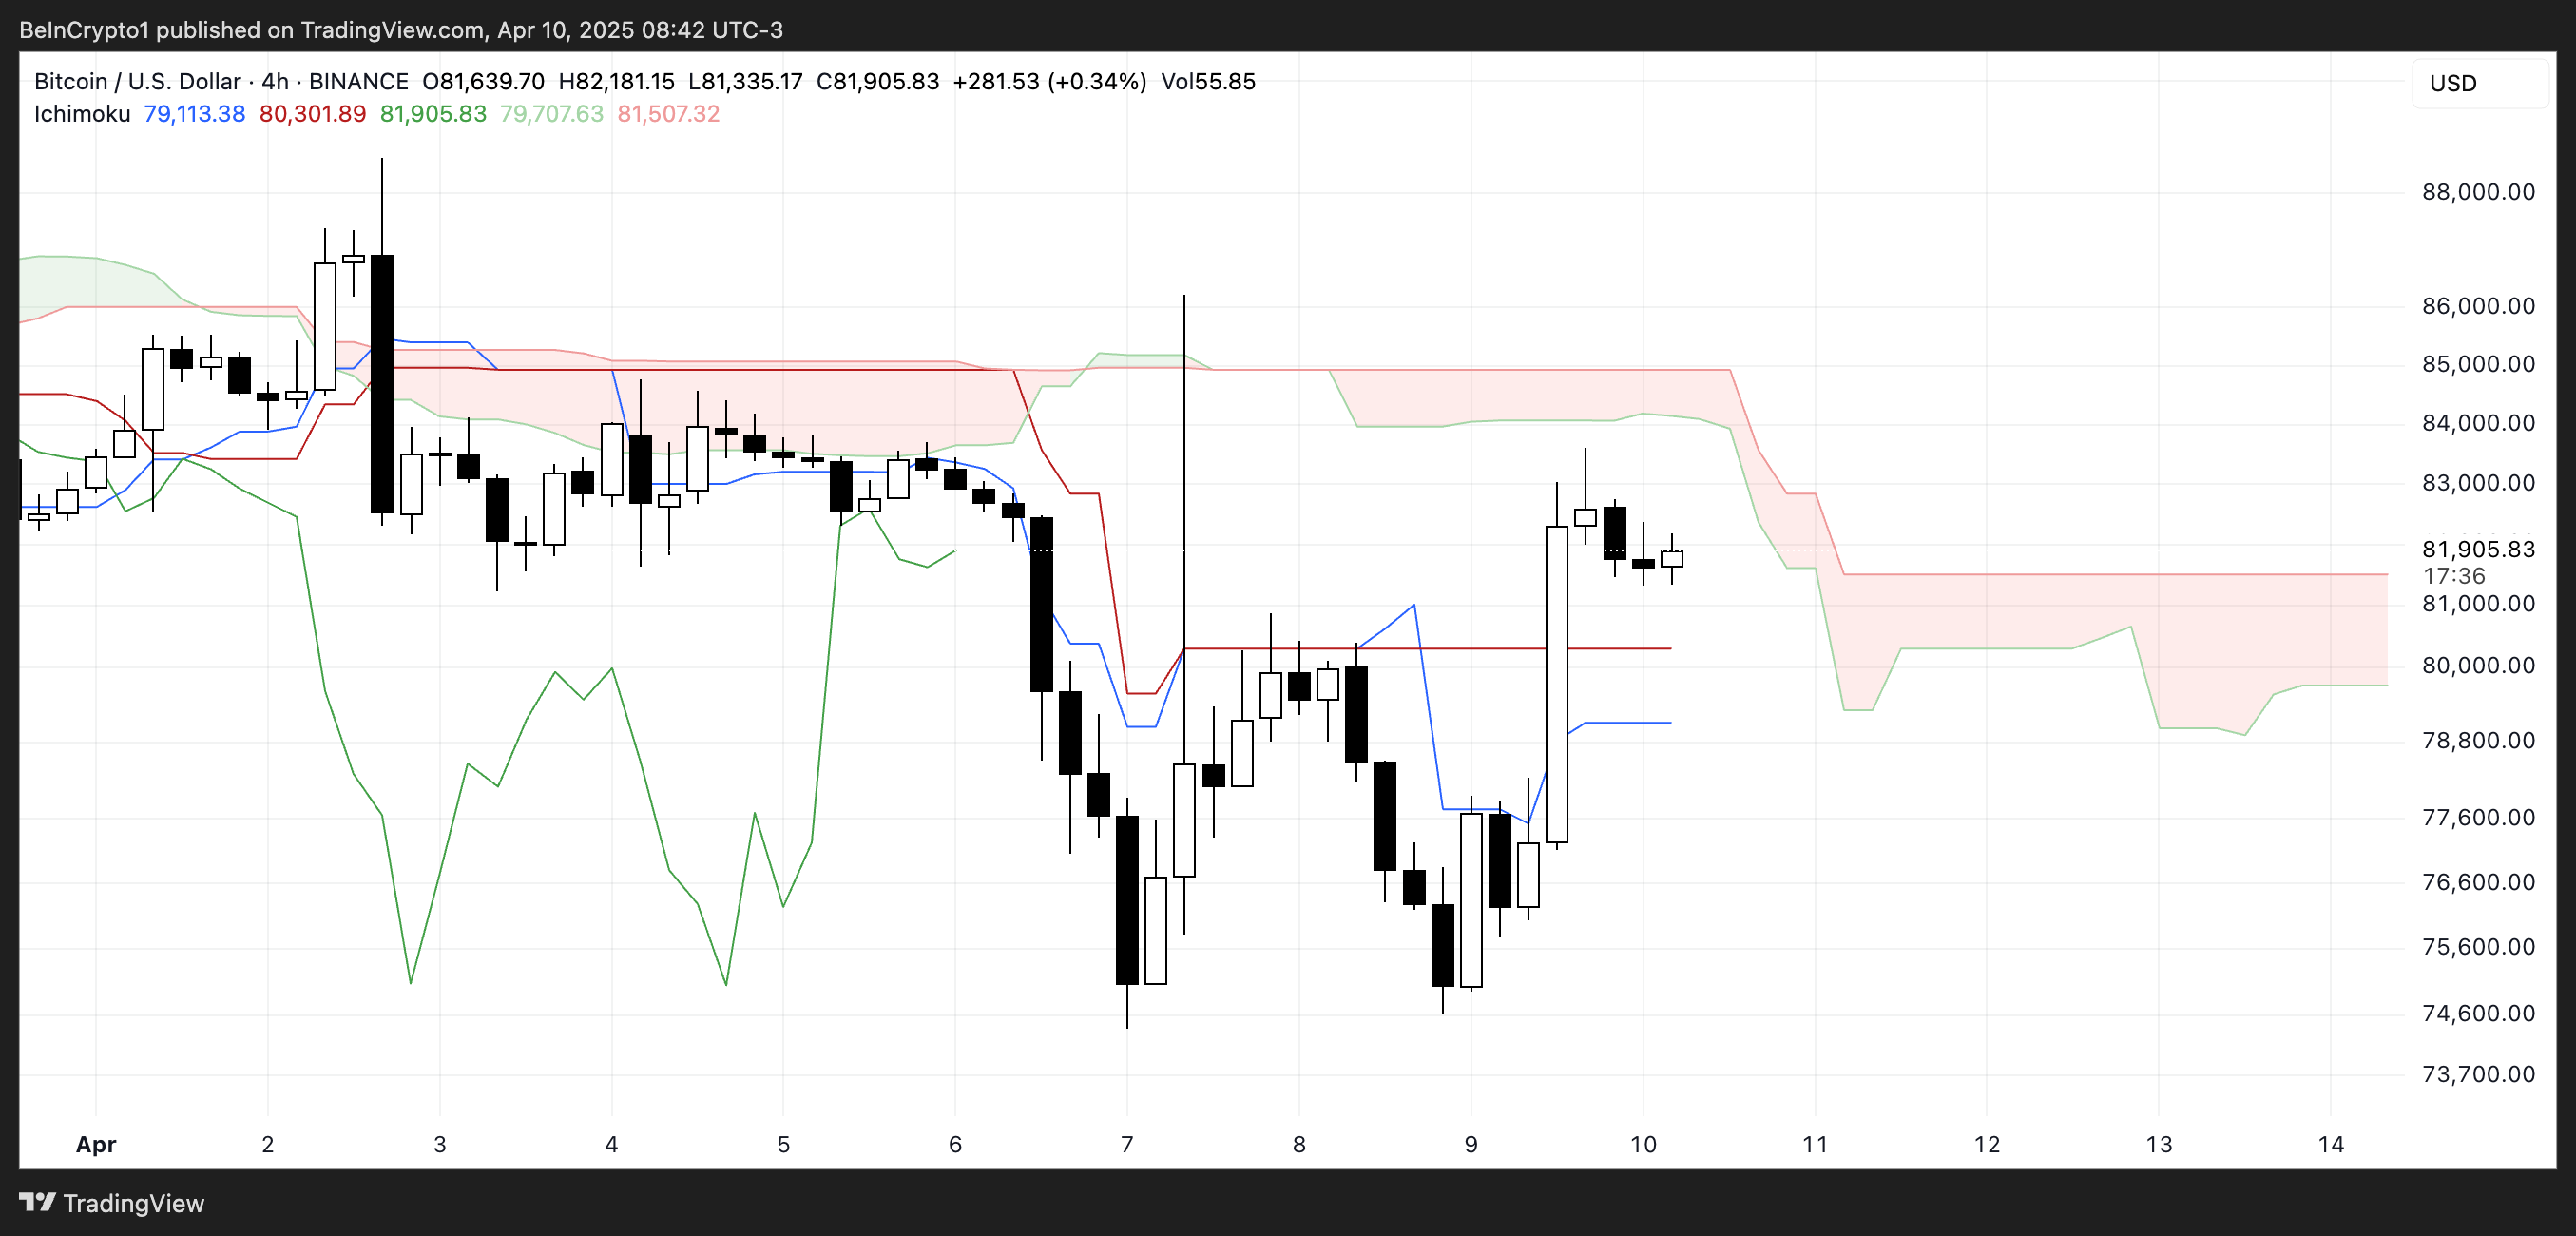
But hey, the Tenkan-sen (blue line) and Kijun-sen (red line) just crossed each other—yay? A bullish crossover! Yet, despite this rosy signal, the flat nature of the Kijun-sen suggests we’re not exactly in a rush to the moon.
Oh, and the Chikou Span (green) is above the price candles and the cloud, which gives us a bit of bullish hope… but only if we actually see some follow-through.
While the Ichimoku Cloud hints at some bullish potential, the weak momentum and thin cloud say, “Don’t quit your day job just yet.”
Bitcoin: Is the Party Just Getting Started, Or Are We Heading Back to the Couch?
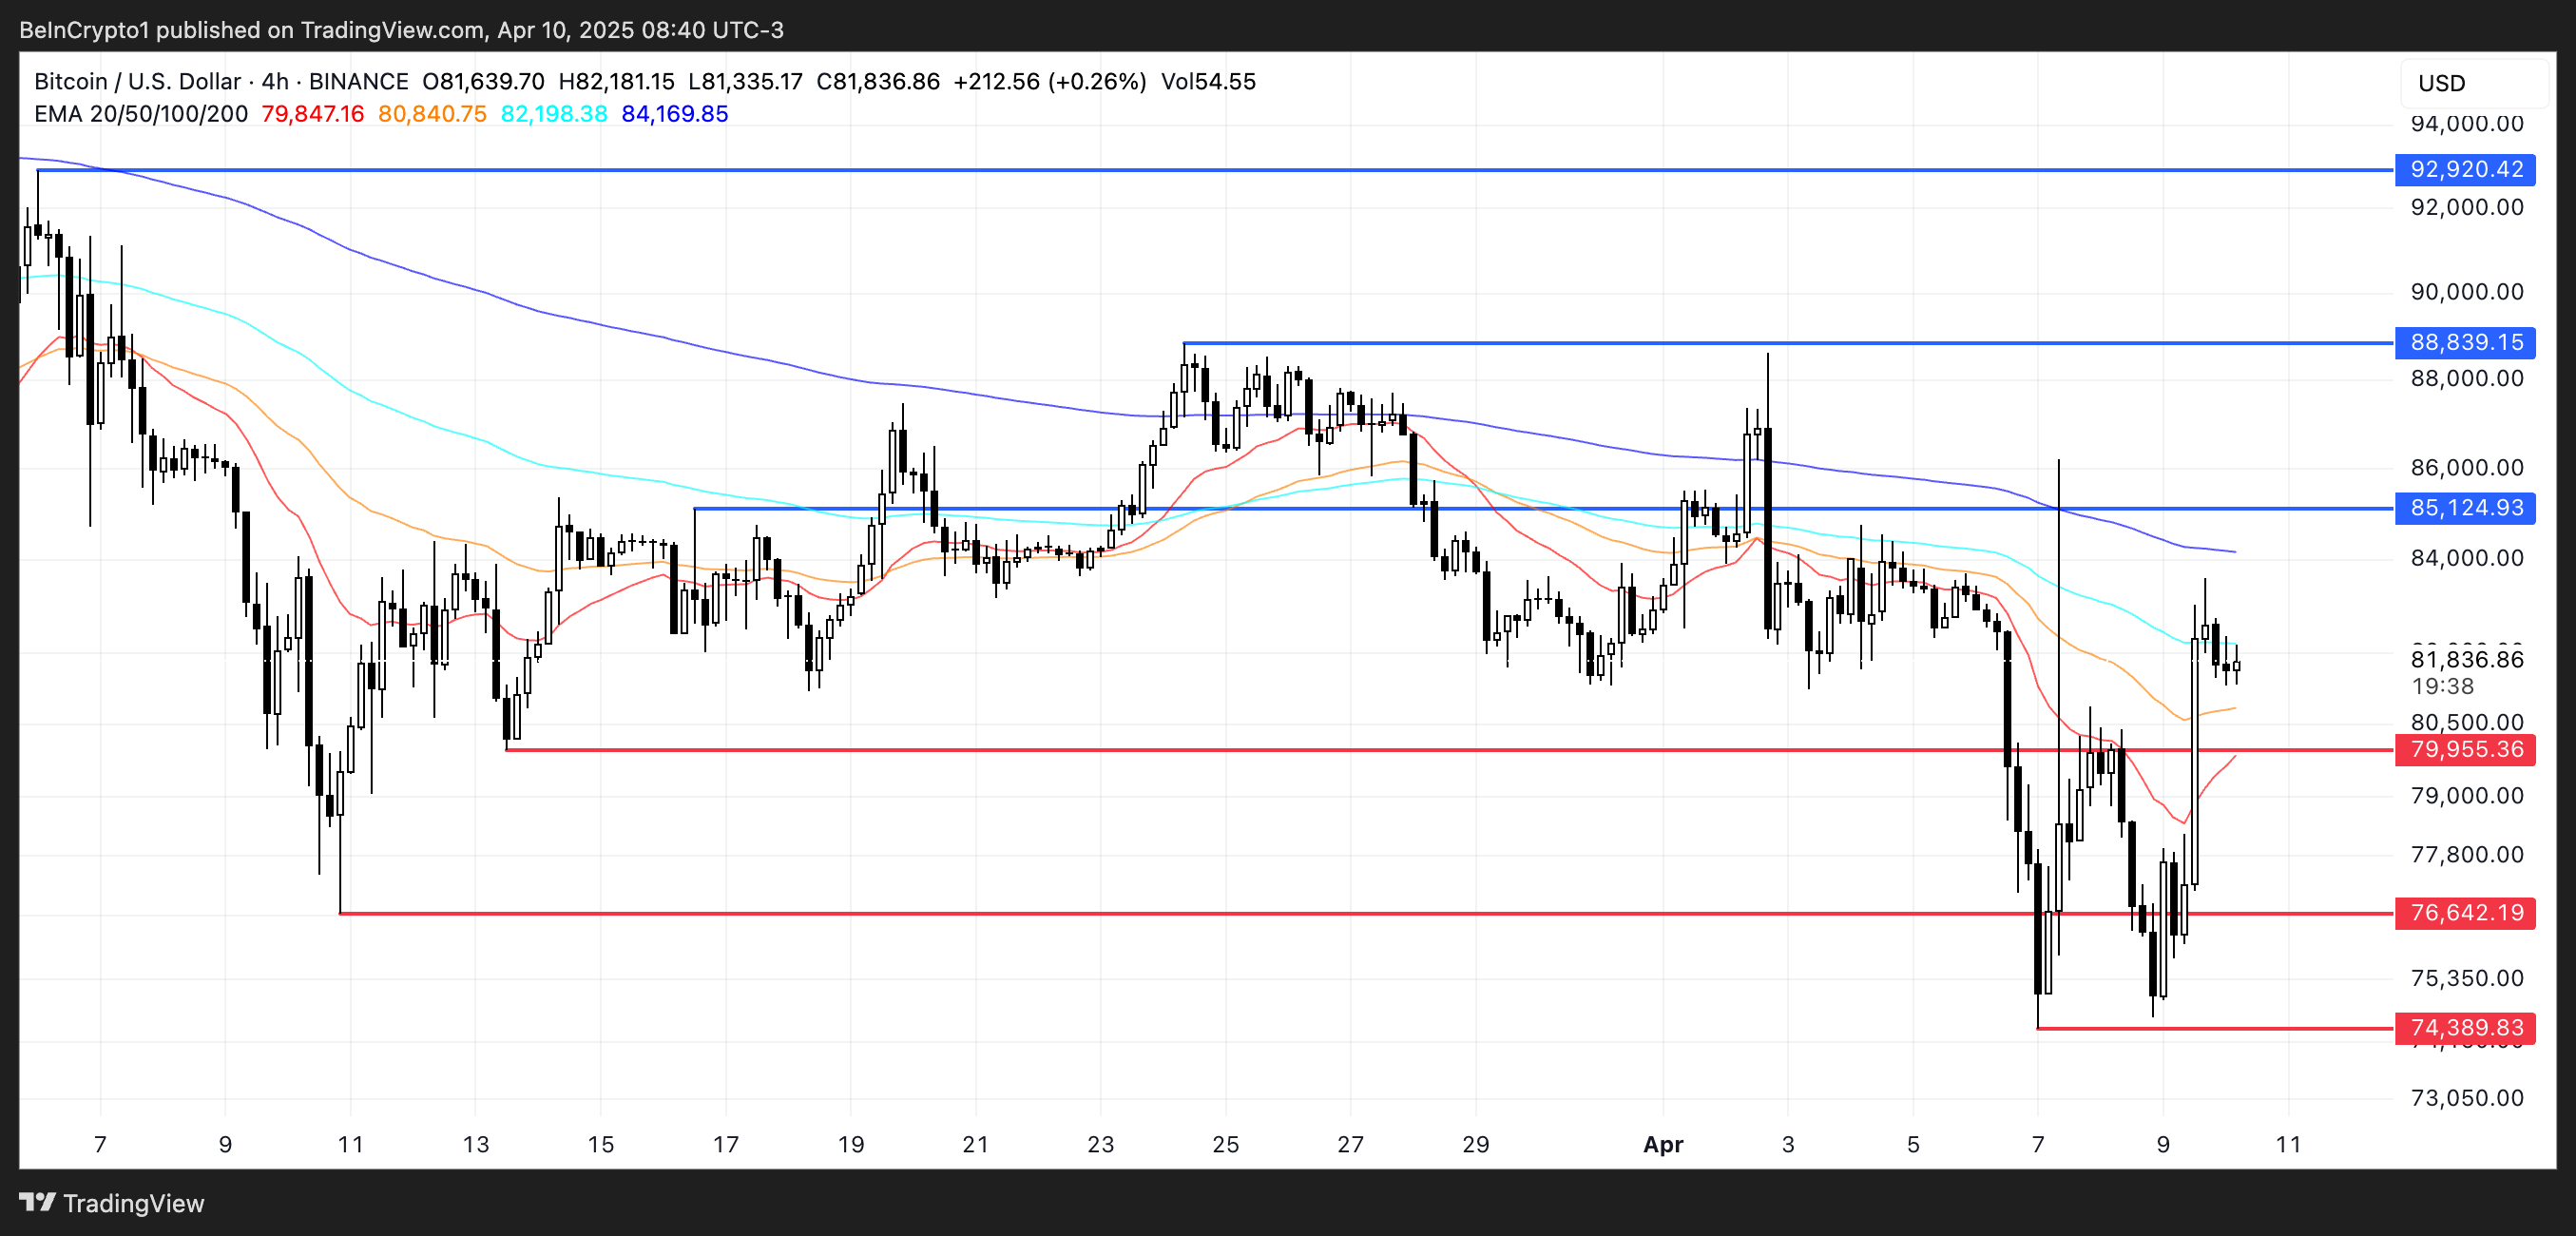
Now, let’s talk about Bitcoin’s EMA structure. Spoiler alert: It’s not exactly in the party mood. The short-term exponential moving averages (EMAs) are still hanging out below the long-term ones, signaling that the bear market might still be calling the shots, even while this brief rally prances about.
But wait, if the current momentum keeps going, we might just see a golden cross—a beautiful moment when the short-term EMAs finally cross above the long-term ones. That, my friends, could signal a shift in trend strength, and we could be headed toward new highs—around $85,124, to be exact. If we’re lucky, we might even break through to $88,839 or $92,920.
Yet, there’s a hitch. Bitcoin stayed flat after the US CPI (Consumer Price Index) showed inflation was, well, cooling. So much for the rally, right?
Analysts are still biting their nails, wondering if this recent bounce is just a fleeting moment of glory or a full-on trend reversal. If Bitcoin fails to lock in the trend, it might slip back to test support at $79,955. And if that level doesn’t hold, we’re looking at a potential drop to $76,642. And if, heaven forbid, Trump’s tariffs make a return? Well, don’t be surprised to see Bitcoin dip as low as $74,389.
Read More
- Gold Rate Forecast
- Silver Rate Forecast
- EUR TRY PREDICTION
- ETC PREDICTION. ETC cryptocurrency
- Brent Oil Forecast
- Hyperliquid’s HYPE Breaks Records, Markets Go Wild! 🚀💰🔥
- Incentiv’s Testnet Triumph: When Blockchain Meets Community Love 💖💰
- Canary’s Trump Coin ETF: A Delusional Gamble? 🐦💸
- 💰 BTC to $85K?! 🤯
- Ethereum’s New Trick: Tokenizing the World’s Wallets 🚀
2025-04-10 17:27