- The Bitcoin Rainbow Chart is like that optimistic friend who insists everything will be fine, projecting a potential $200k-250k target by the end of 2025.
- Technical analysis, however, gives you the cold, hard truth: the trend is still bearish for now. Sorry, folks.
Bitcoin [BTC] is lounging at $84.5k as we speak, but don’t get too comfy. The trading session on April 14th is expected to be a rollercoaster, and this week might see BTC suffer some losses. Hold on tight!
And if you’re wondering why things feel like a bad dream, The Kobeissi Letter is pointing out that the bond market’s uncertainty is playing the role of the villain here, dragging down the stock market, which then drags down crypto. Ah, the joys of interwoven financial drama.
Oh, and remember that spike in Open Interest (OI)? Yeah, it was a red flag, but there’s still a tiny hope for a move towards $87k. But seriously, don’t hold your breath for a bullish breakout just yet.

The Crypto Fear and Greed Index is currently sitting at a solid 31, which is basically the market’s way of saying “We’re terrified.” Everything’s been super fearful since February, and guess what? That hasn’t changed. Even though BTC is back above the $82.5k mark, there’s just too much market chaos for any upward trends to stick.
Bitcoin is “still cheap,” according to the overly optimistic Rainbow Chart

The Bitcoin Rainbow Chart insists BTC is still “cheap.” So, if you believe in the magic of rainbows and unicorns, you might see it as a golden buying opportunity. Historically, the “Sell, seriously SELL!” zone has marked the top of the cycle, but let’s not get too carried away, folks.
If history repeats itself (spoiler: it doesn’t always), BTC could hit the “SELL!” territory by late 2025, pushing the price to $250k. But hey, don’t make any rash decisions based solely on a rainbow chart. It’s fun, but it’s not your financial advisor.
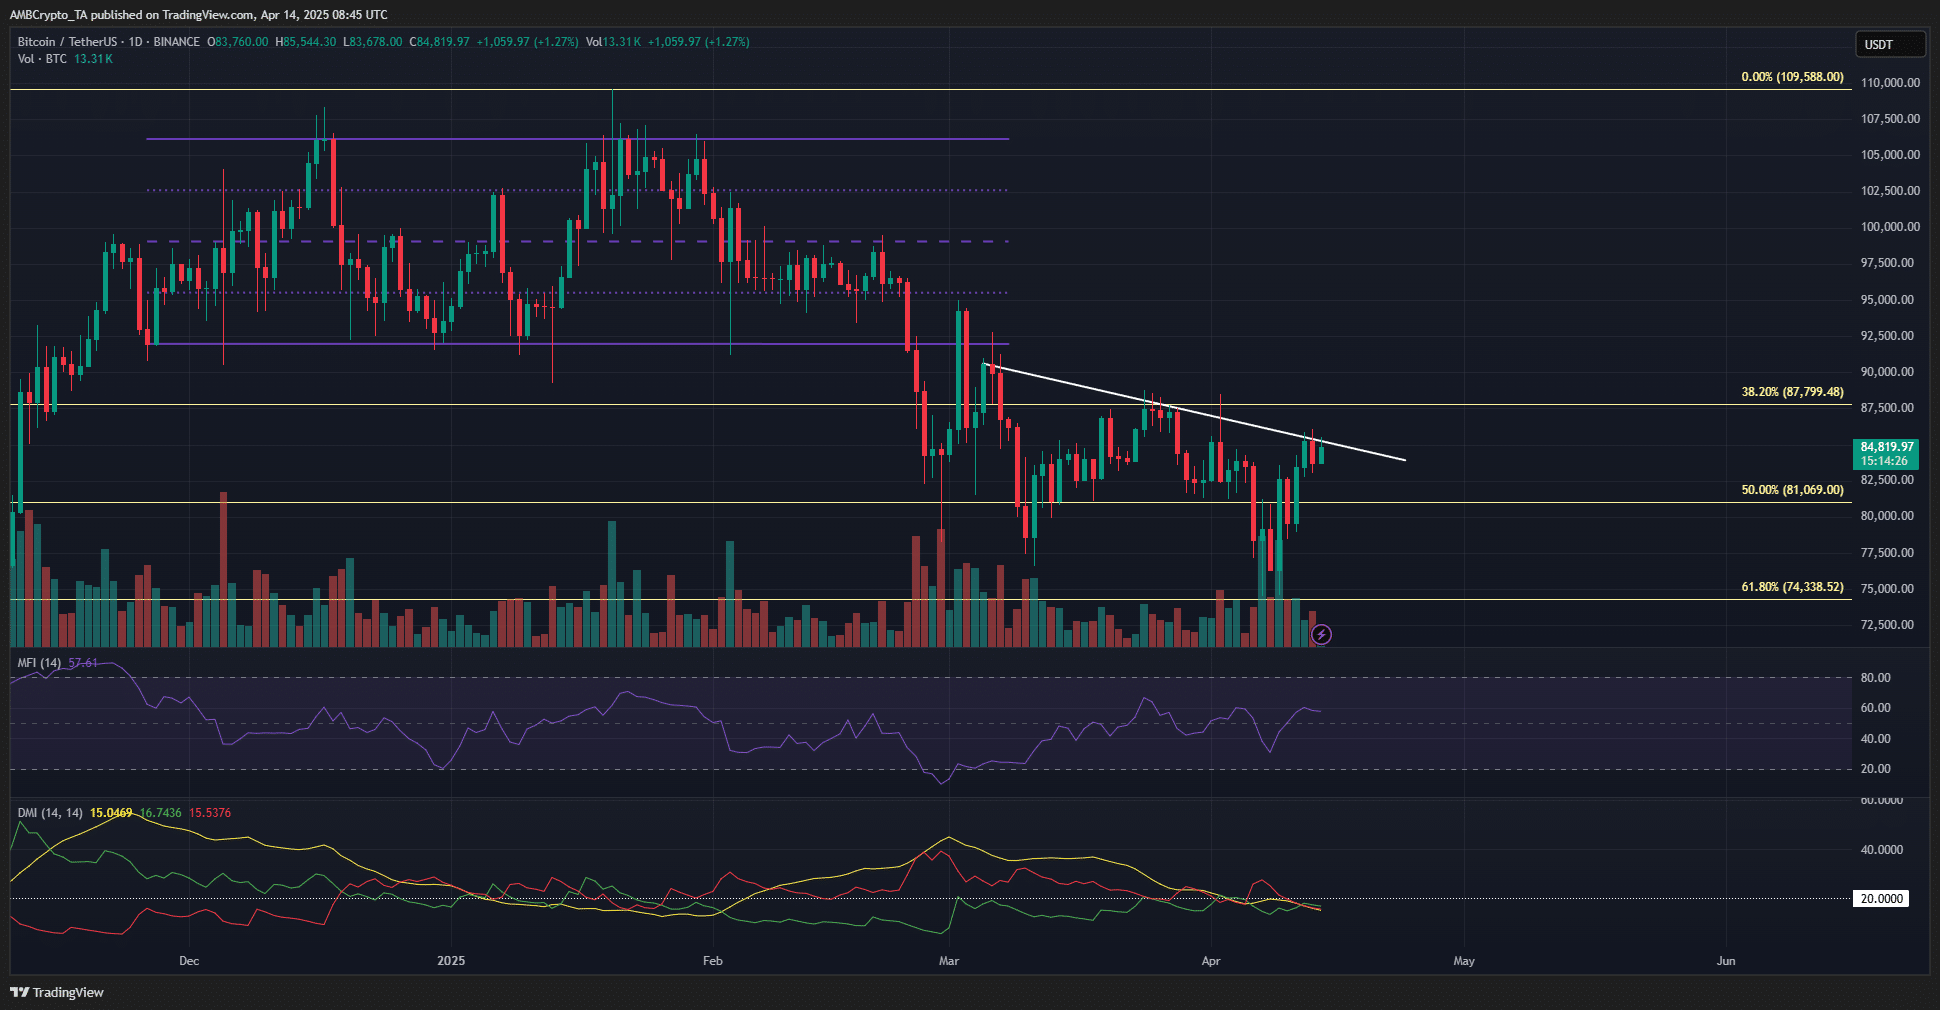
The 1-day chart? Not great, Bob. It shows that the trend is still bearish. No new highs, no signs of life, just a lot of price slumping under a trendline resistance for the last month. The MFI is hanging just above 50, so it’s not exactly a bullish market, folks. Let’s keep it real.
The DMI is telling us that there’s no strong trend forming, since the ADX (that yellow line) is chilling below 20. With a bearish structure and fear in the air, it might be time for traders and investors to either sit this one out or get ready to bet against BTC.
On the bright side (or the slightly less dark side), there’s a build-up of liquidation levels around $89.5k. So, yeah, a short-term price target of that level could happen, but don’t get your hopes up too high.
Read More
- Silver Rate Forecast
- Polymarket’s 3.14% Pie: A Slice of Genius or Just Crumbs?
- ONDO PREDICTION. ONDO cryptocurrency
- Coinbase’s OCC Nod: Not a Bank, Just A Trust-Big Moves Ahead!
- Claude’s ID Fiasco: Anthropic’s Latest Farce in AI Theatre
- Brent Oil Forecast
- XRP’s Institutional Comeuppance: Finally, a Seat at the Table
- Gold Rate Forecast
- Crypto’s Last Gasp: Lummis Pleads, ‘Act Now or Regret Eternally’
- Bitcoin at 75k: The Trigger That Could Unleash a Rally
2025-04-14 16:10