As May comes to an end, Bitcoin is currently trading around $77,500. The market is steadily bouncing back from the $75,000-$76,000 range, following a failed attempt to break past $80,000 last week.
The market has handled the recent price drop well without collapsing, and the established upward trend remains strong. Data from the blockchain suggests the situation is even more positive than the price chart indicates. Investor confidence is growing and is now at levels not seen since the start of the last major price increase.
Bitcoin Price Analysis: The Daily Chart
Looking at the daily chart, the price has continued to follow an upward trend since February, finding support around $75,000–$76,000. It recently bounced off this level and is now heading towards $77,500. The 100-day moving average is also trending upwards, currently around $72,000, and is getting closer to that same support area. This suggests a solid and growing support level that will likely continue to strengthen over the coming weeks.
The Relative Strength Index (RSI) is currently around 50, suggesting a lack of clear upward or downward price movement. For the price to start rising again, it needs to break above $80,000 and move past its 200-day moving average. These are the first steps needed to regain positive momentum.
If the price reaches $88,000–$90,000, that will likely be a key resistance level. However, if the daily price closes below $75,000, especially near the $72,000 moving average, it would signal a significant setback for the current recovery.
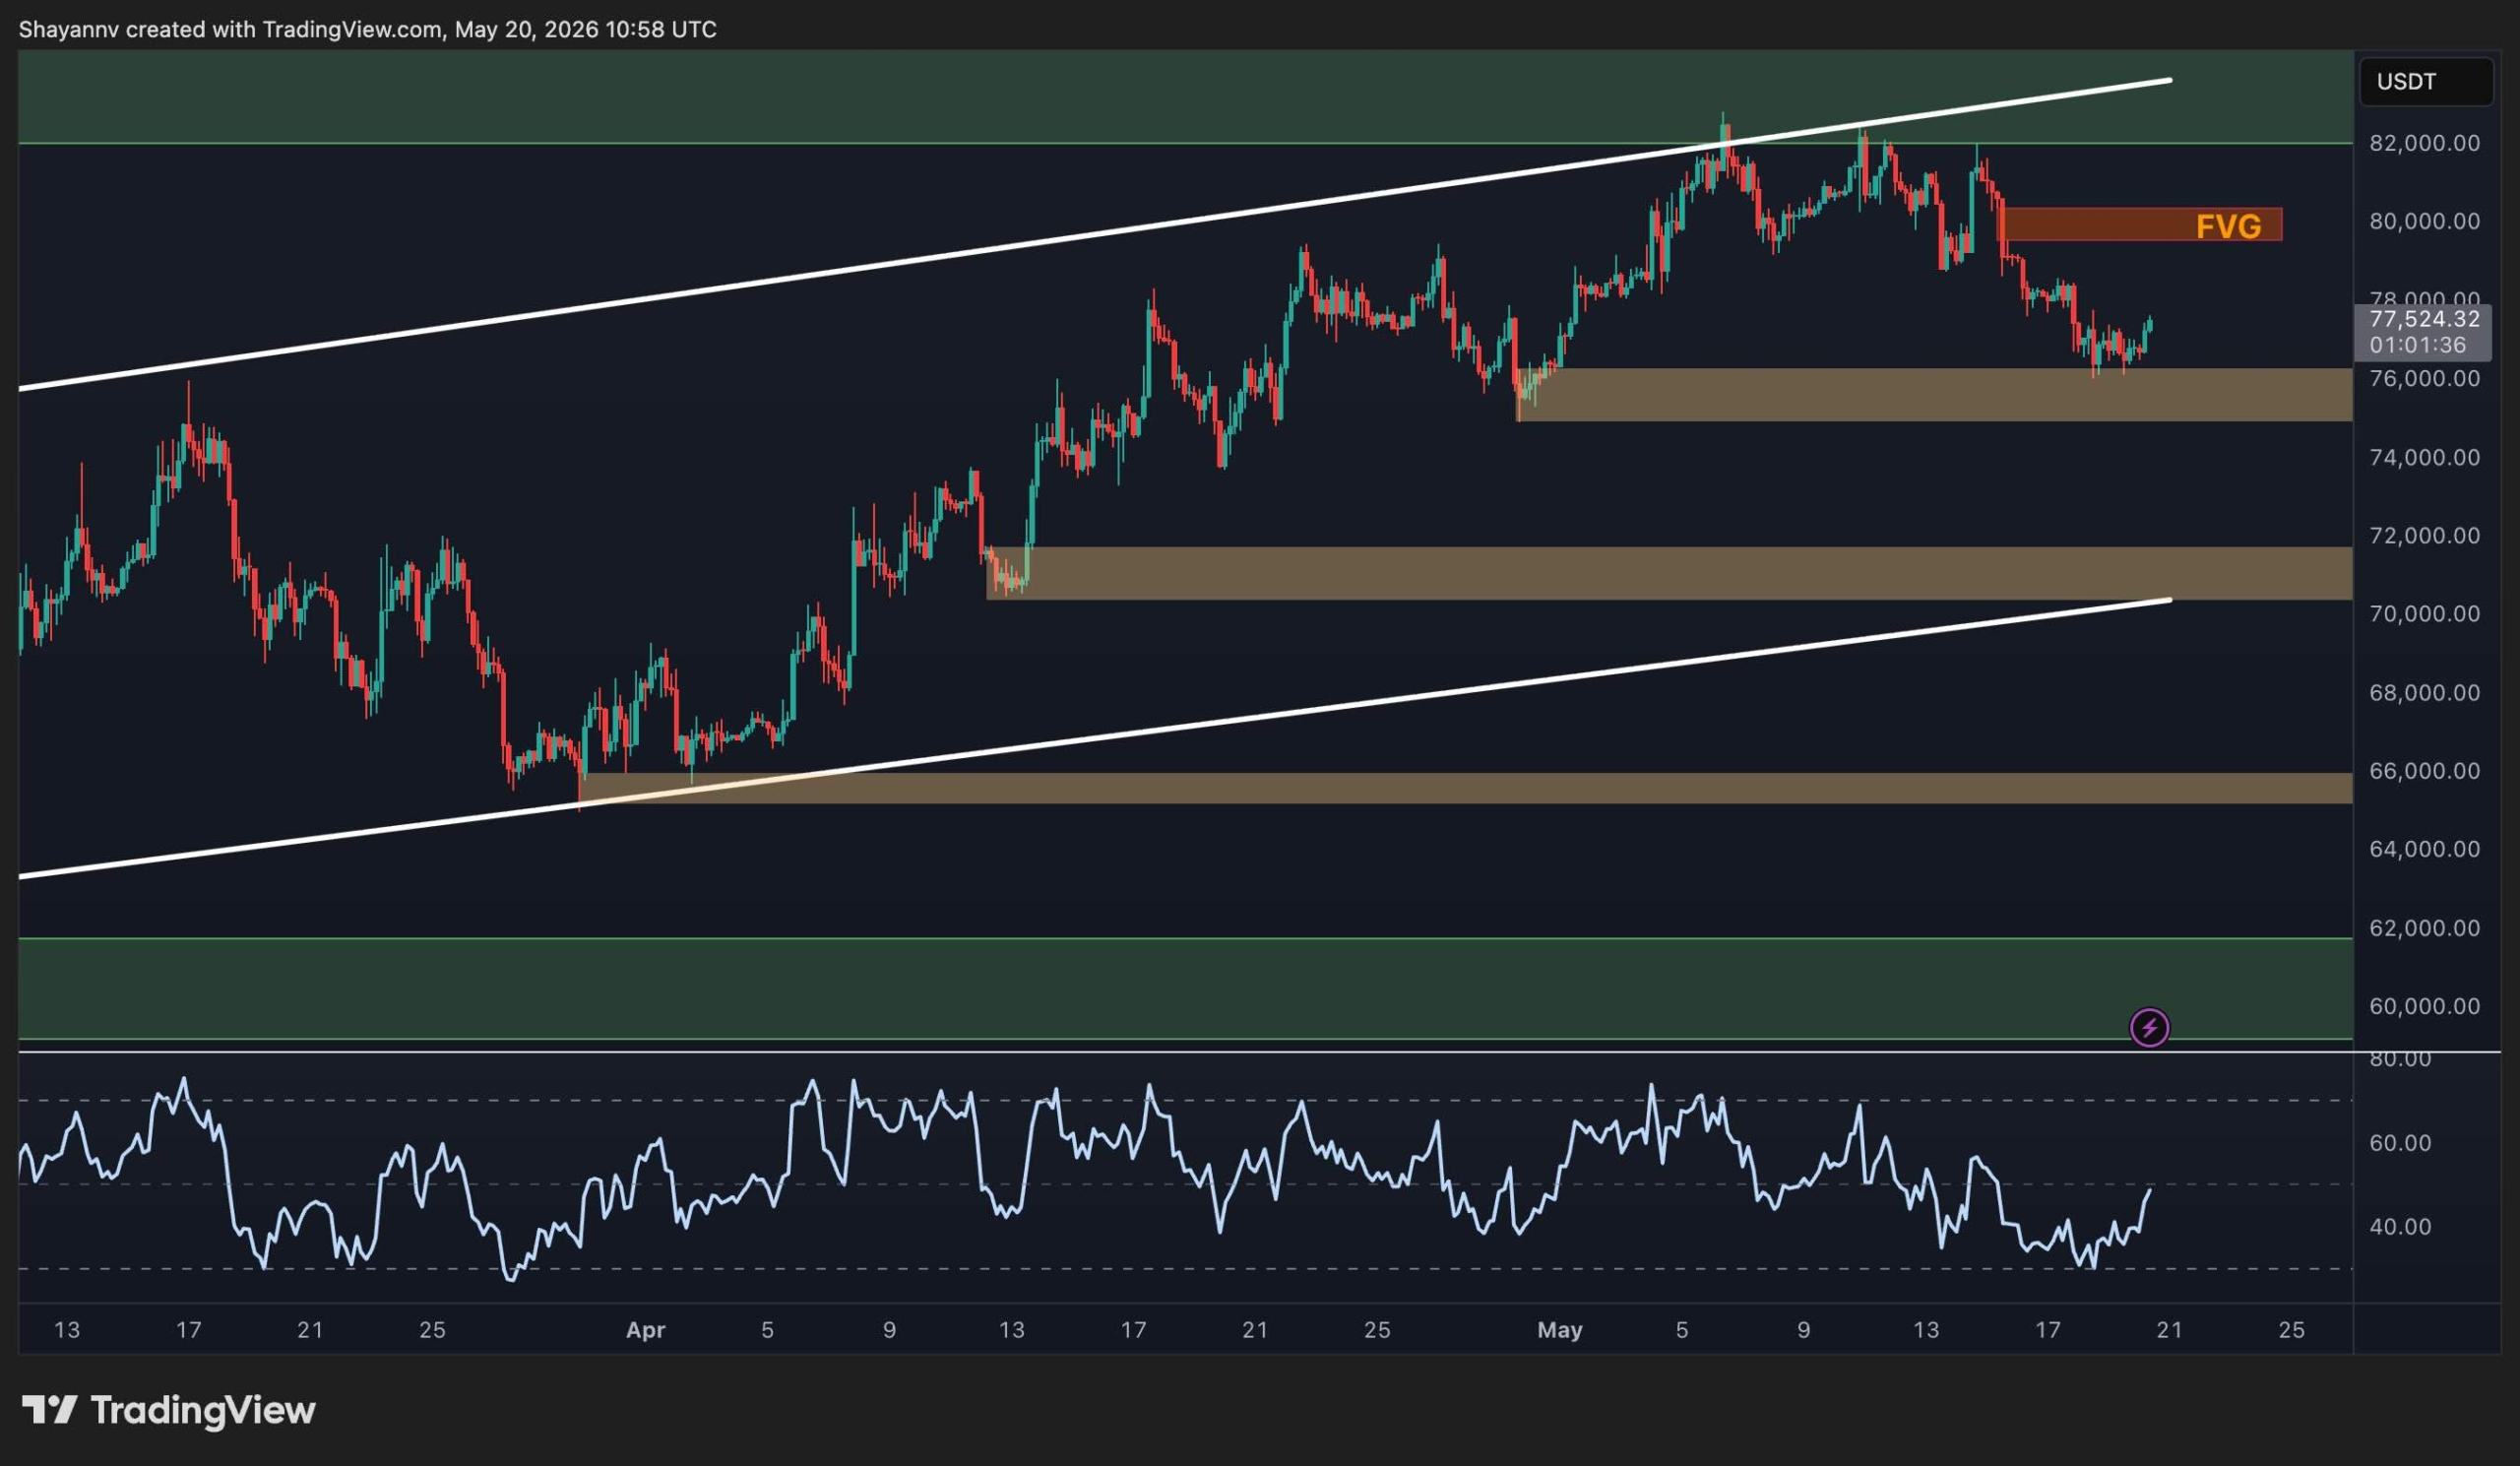
BTC/USDT 4-Hour Chart
The price recently rebounded from the $75,000-$76,000 support level, causing a key indicator (the RSI) to move from around 30 to near 50. Now, the price is heading towards a gap in the market near $80,000, where there are more sellers than buyers. This gap formed after a quick price drop from $82,000, and typically the price will return to this level to balance out before making a clear move up or down.
Currently, the price is expected to move towards the Fair Value Gap (FVG) in the short term. Breaking above the FVG would indicate that the recent price drop has run its course, and another increase towards the $82,000 resistance level and the top of the daily trading range is likely. However, if the price fails to move above the FVG and falls back below $75,000, it suggests continued selling pressure from the previous failed attempt to rise, potentially leading to a further drop towards the $70,000–$72,000 support area.
On-Chain Analysis
Net Unrealized Profit/Loss, which dipped to around 0.12 in February – its lowest point since October 2023 and a sign of potential market surrender – has rebounded to 0.29. This puts the average Bitcoin holder back into moderate profit, though the market isn’t showing the excessive optimism usually seen before significant price peaks.
The historical parallel is precise. NUPL crossed 0.29 in late 2023 near $40k on its way to the bull market peak. The journey from that level to the 0.50 threshold, where momentum historically accelerates, corresponded to a price move from roughly $40k to $80k. At $77.5k with NUPL at 0.29, the on-chain sentiment structure suggests the market is in a similar position. It’s likely past capitulation, rebuilding confidence, but with the majority of the cycle’s unrealized gains still ahead rather than behind.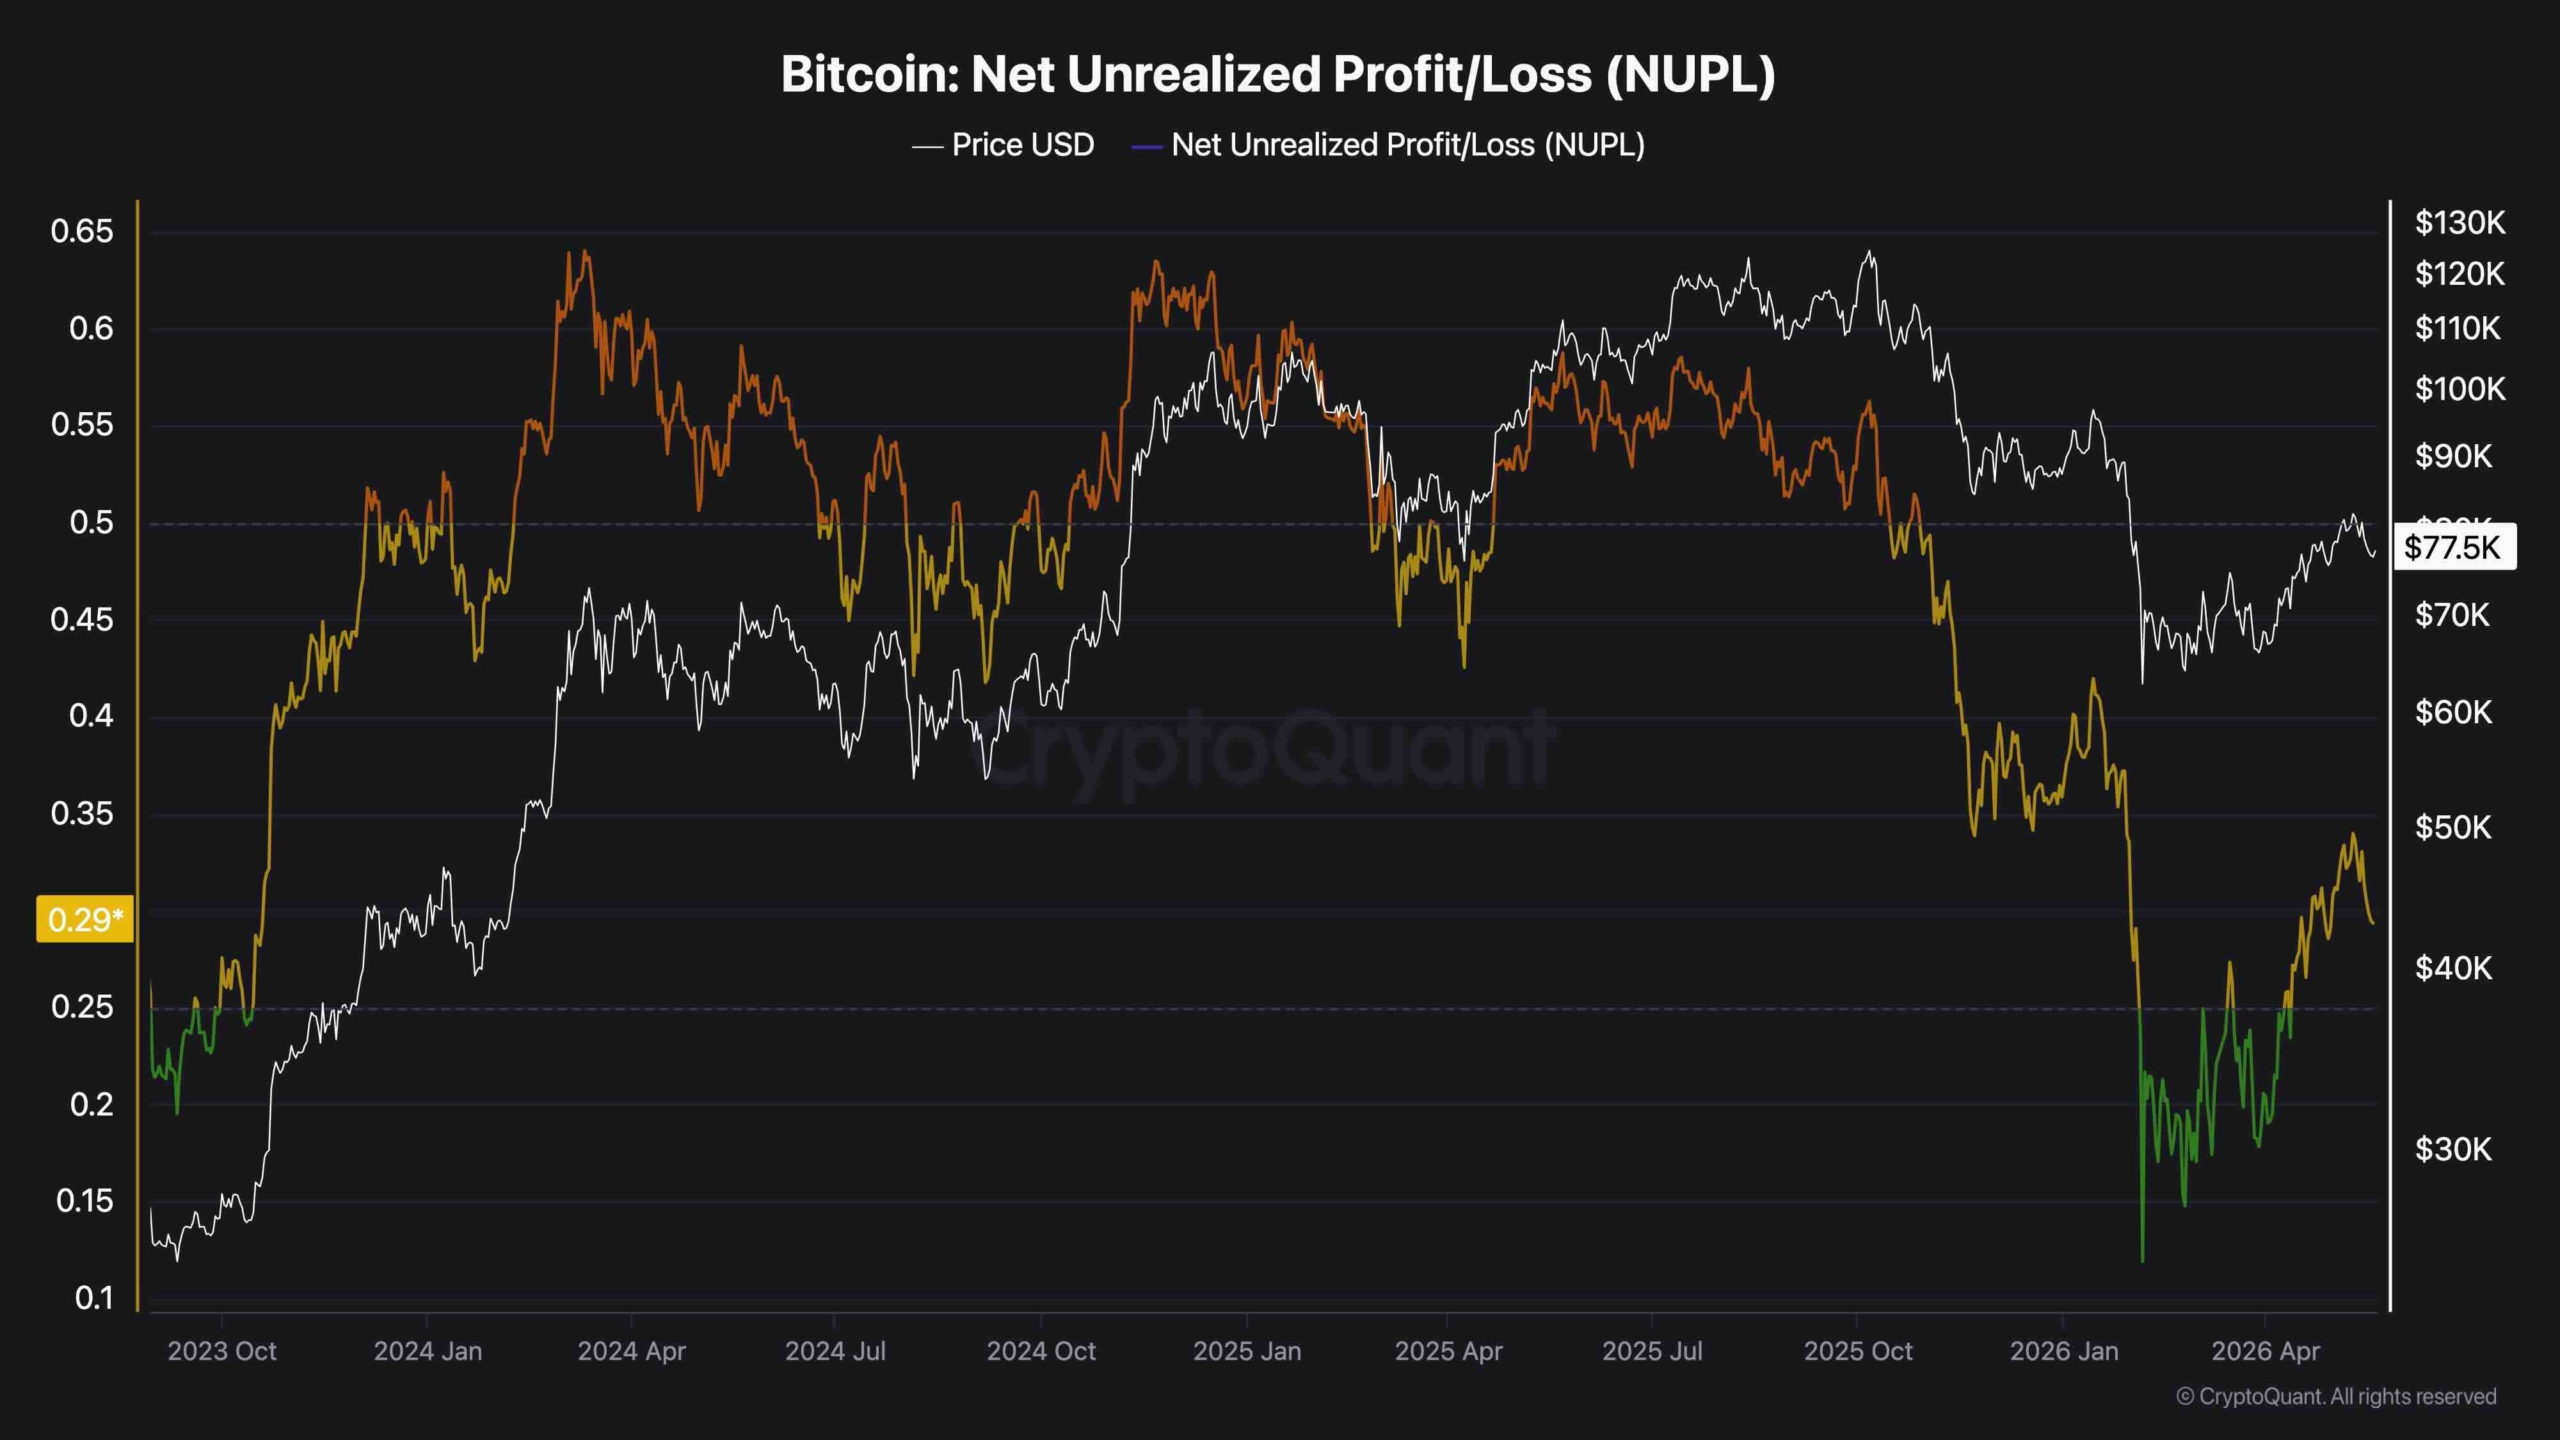
Read More
- Pi Hotel Vietnam: First to Accept Pi Coin Payments in Real-World Transactions
- Silver Rate Forecast
- USD TRY PREDICTION
- USD IDR PREDICTION
- The Quiet Rise of Ethereum: Is it Really Gone or Just Getting Started?
- Gold Rate Forecast
- Brent Oil Forecast
- Warsh’s Fed Debut: A June Rate Cut? Don’t Hold Your Breath, Darling
- Cryptocurrency’s Grand Illusion: Bitcoin’s $70k Waltz and the Phantom of Asian Tech Stocks
- RENDER PREDICTION. RENDER cryptocurrency
2026-05-20 16:22