Brace yourselves, folks! Analysts are glued to their screens, watching with a cocktail of suspense and mild disbelief as the bears meet the mighty, long-term structural support line at a critical technical juncture. It’s like watching a car crash in slow motion, only with more charts and fewer airbags.
Analyst Highlights Key Long-Term Support Retest
Enter Analyst Master Kenobi, the Jedi of XLM price predictions, who took to X (formerly Twitter, obviously) to point out that our beloved coin is having a little rendezvous with a long-term ascending support line. This isn’t just any old support line – oh no, this one has a history. It’s been responsible for some market reactions that could make you spill your coffee. The daily chart shows two major rebounds, marked by yellow arrows. Yes, yellow arrows. Because why not? The token surged after touching this very structural level, and now it’s back for more. Can it do it again? Stay tuned.
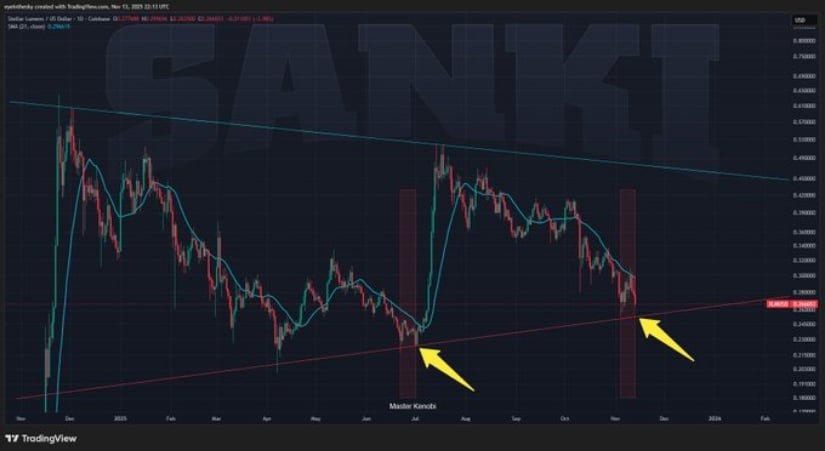
The coin is currently playing below the 21-day SMA, a signal that short-term bears are throwing a bit of a tantrum. But, dear reader, fear not. The long-term trend is still holding steady, as long as that ascending support line doesn’t decide to take a vacation. Previous encounters, including the dramatic July retest, brought some serious volatility – red reaction zones, flashing lights, the works. If it successfully defends this level, we could see another climb. A breakdown, however, would send us all running for cover. So, yeah, a big moment coming up.
Open Interest Signals Possible Volatility Return
Now, on to the next thrilling chapter in the XLM saga. We get a second chart showing XLM/USD on the 1-hour timeframe. It’s like watching a soap opera in real-time, where the price structure shifts from higher highs (we were all hopeful, once) to a downtrend of lower highs and lower lows. Think of it as the plot twist that nobody wanted. Recent candles, though? Stabilizing in the 0.264-0.270 range. Not exactly thrilling, but it’s holding steady in a narrow consolidation zone, which doesn’t scream “breakout” just yet.
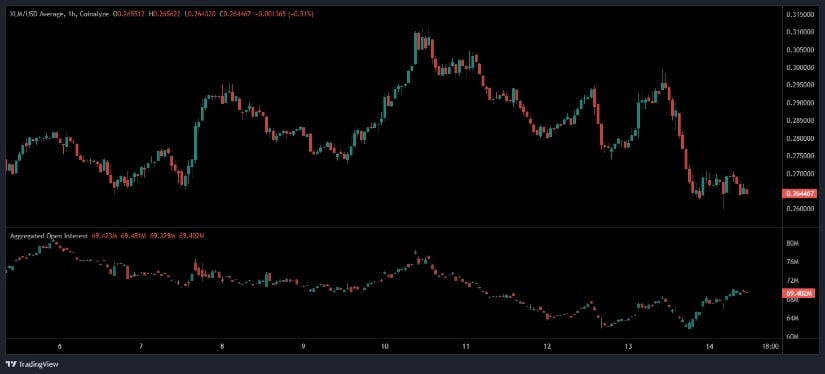
Meanwhile, Open Interest (OI) – that’s the fancy term for how much speculative activity is happening – has been steadily declining during the major selloff. OI’s like the stock market’s version of a mood ring. But lately, it’s been rising again as the price moves sideways, which is a little like the calm before a storm. A break above 0.270-0.275? Buckle up. Below 0.260? Even more fun to watch. We’re entering the exciting phase where everything could go boom or, well, not.
Market Data Shows Consolidation Near 0.28 USDT
Let’s check in with the numbers. According to BraveNewCoin (because that’s where all the cool kids get their data), Stellar is trading at 0.27 USDT. That’s a 4.40% decline in the last 24 hours, which is just a hair above “meh.” But don’t let that fool you – the market cap is still around 9.02 billion USDT, with a 24-hour trading volume of 353.09 million USDT. So, clearly, the coin has some staying power, even if it’s not winning any beauty contests right now.
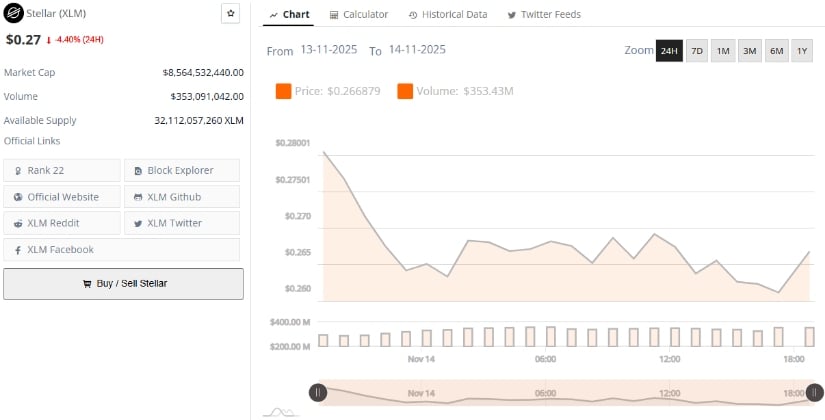
Despite the recent price dip, traders are still hanging around like that one guy at a party who refuses to leave, even though everyone’s trying to go home. Analysts note the consistent trading volume, which is proof that long-term holders are still holding tight. The price has been bouncing between 0.276 USDT and 0.290 USDT, which is basically the crypto version of standing still while trying to look like you’re going somewhere.
Indicators Show Bearish Momentum With Possible Stabilization
Now, for the grand finale: the technical indicators. Right now, the coin is chilling around 0.264 USDT, way down in the lower region of its Bollinger Bands. Sounds fancy, right? Well, it means price is correcting. And no one likes corrections, unless you’re a math teacher. The bands are tight, which means volatility has taken a little nap. The crypto even tapped the lower band at $0.254, signaling that it might be oversold. But, sadly, buyers haven’t exactly rushed in like it’s Black Friday.
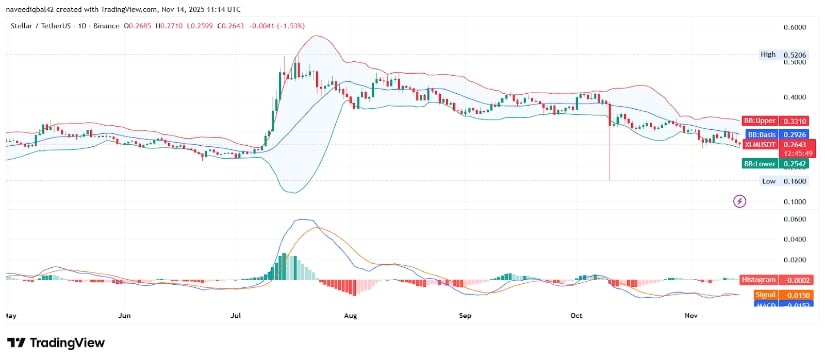
The MACD is still in bearish territory, with the MACD line hanging out below the signal line. But – plot twist – the histogram is near neutral. So there’s that. If you’re a bull, reclaiming the baseline is a must. Otherwise, brace for the possibility of a breakdown below the lower band, which would open the door to the $0.24-$0.25 support zone. Upward attempts need to clear $0.28 first, and we all know how tricky that can be.
Read More
- ETH PREDICTION. ETH cryptocurrency
- Gold Rate Forecast
- Warning: Binance-Listed Siren Token Rallies 30X—Here’s Why You Should Stay Away
- Brent Oil Forecast
- Crypto Listings Fail: Market Dives in Disgrace 🚀💸
- Bitcoin Tops $70,000 as US-Iran Ceasefire Talks Lift Risk Appetite
- Is Trump REALLY Winning? AOC’s Wild Call for Impeachment Over Iran Chaos!
- Silver Rate Forecast
- Dogecoin Whales Gobble 800M Coins While Solana and Bitcoin Play Market Leapfrog
- TRX EUR PREDICTION. TRX cryptocurrency
2025-11-15 00:04