TL;DR: Because who has time?
- XRP is hanging out comfortably above the 21 EMA, that mystical level that made previous holders very rich or very sad-depending on timing.
- Long-term charts look like they’re playing a game of “Who Can Confuse Everyone the Most?” with consolidation below $3.31, just like in the good old days of “Wow, This Actually Happened.”
- Meanwhile, at the short-term support club, $2.71 is holding the line-kind of like that one friend who always shows up, no matter how much chaos ensues. Targets? $3.20 and $3.60-because who doesn’t love a progressing plan?
So, XRP is Basically Running the History Book Again, just with a Little Less Flair
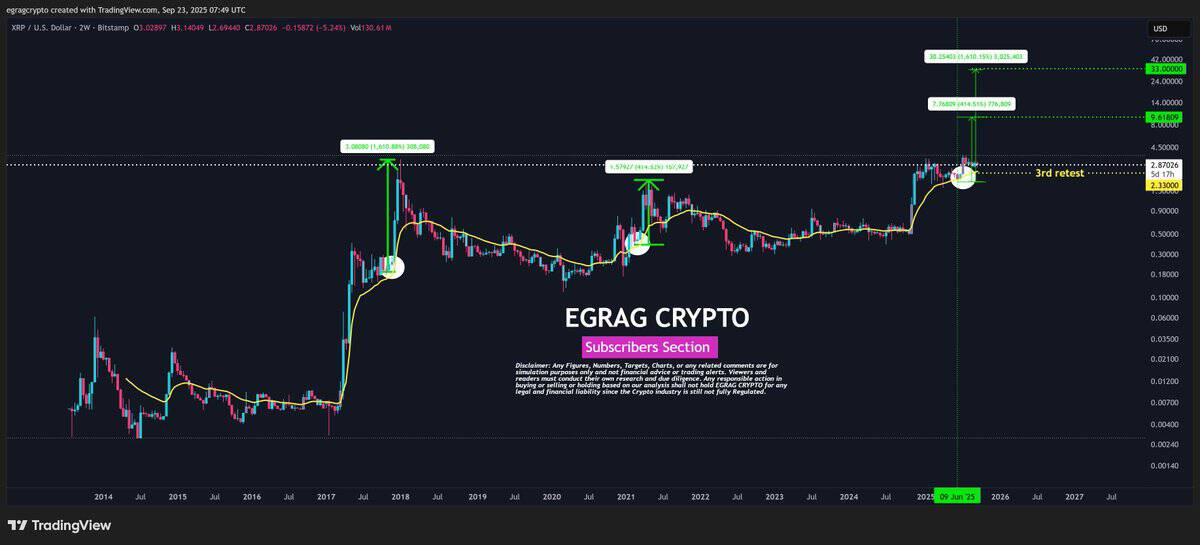
According to the high priests of crypto analysis-whoever they are-XRP might be gearing up for a move that could make your other investments look like a bad joke. The 21-week Exponential Moving Average (EMA), that tricky little line that traders whisper about in hushed tones, has historically been a sort of “launchpad” for XRP’s big moments.
Back in 2017, XRP hit the 21 EMA twice-and then, quite literally, shot off into the stratosphere, with gains of over 1,600%. Fast forward to 2021, despite the SEC trying to turn it into a legal game of “Where’s the Clarification?” XRP managed to retake the EMA and then went up by over 400%. Now, after a little summer fling retest of June 9, 2025, the same magic might just be happening again.
Drawing from these dramatic reenactments, analysts suggest the coin could rocket to around $9.60 if it mimics 2021’s slow burn, or to an eye-popping $33 if it follows the 2017 rulebook. But don’t get out your rockets just yet-these are more “could be” than “guaranteed,” and definitely not a weather forecast.
The chart’s not handing out timetables-more like a “stay tuned” message. If current calm persists, XRP might just follow its ancient, somewhat predictable pattern of “faffing about sideways for a bit before deciding to make everyone look silly.”
Old Patterns Keep Coming Back Because Crypto Has a Memory… or Something
Another chart, this one courtesy of EtherNasty, shows XRP’s long-term dance from 2013 to 2025, and it’s basically a series of “up, sideways, up, sideways, and then maybe up again?” Tales from the crypt-literally-of the same old pattern. The previous peaks at $0.06 (2013), $3.31 (2017), and $1.97 (2021) are like milestones on a road trip everyone’s taken before, usually right before things got exciting-or chaotic.
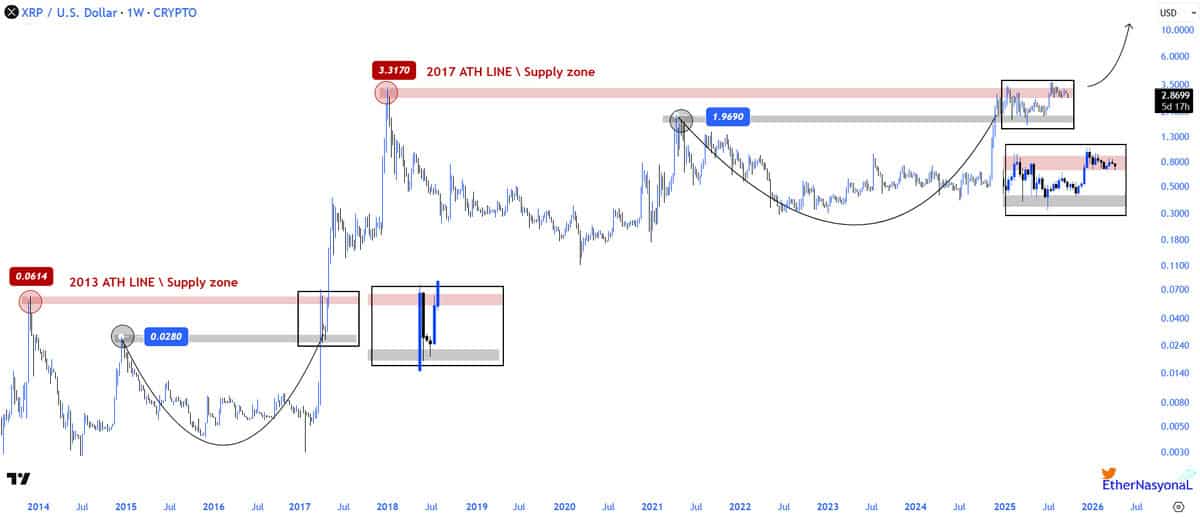
Right now, XRP is just below that 2017 high, kind of like a student waiting nervously outside the exam room, trying to look confident. It’s consolidating into a “ready to break out” pattern, because that’s what it does-rumble quietly before a big leap.
If XRP manages to clamber over $3.31, we might be looking at $6, $10, or perhaps both in a particularly optimistic daydream. Patterns are like that-they like to repeat, apparently, for those of us who like repeating ourselves.
The Short-Term Support Level That’s Basically the Gatekeeper at $2.71
Analyst Ali Martinez-whoever they are-showed a chart with a magic number: $2.71. It’s been tested more times than that questionable gym membership, and if it holds, XRP might waddle up to $3.20 and then maybe even to $3.60. That’s a pretty decent stroll if support keeps supporting.
But watch out: a dip below $2.71 would be like falling into a pit of marshmallows-soft but definitely a sign that things might go awry. The support’s holding for now, but crypto… well, it’s as predictable as a cat on catnip.
Read More
- Pi Hotel Vietnam: First to Accept Pi Coin Payments in Real-World Transactions
- Silver Rate Forecast
- USD TRY PREDICTION
- The Quiet Rise of Ethereum: Is it Really Gone or Just Getting Started?
- Gold Rate Forecast
- USD IDR PREDICTION
- XRP CAD PREDICTION. XRP cryptocurrency
- Dash Surges 26% in 24 Hours: Privacy Coins Rally as EU Rules Tighten
- DOGE PREDICTION. DOGE cryptocurrency
- 3 MASSIVE Token Unlocks That Could Blow Up the Market: HYPE, ENA, RED!
2025-09-23 22:11