Oh, Solana’s price may be taking a breather from its recent high of $168, but fear not, dear reader, for the bigger picture still favours the bulls! 🐂
Despite the correction to $160, three key metrics suggest this is more of a pause than a breakdown. So, pour yourself a martini and let’s dive in!
Funding Rates Remain Positive, Reflecting Bullish Sentiment
Solana’s funding rate bars are still green, indicating that long positions are dominant across the market. Even as the price dipped slightly, traders are still paying a fee to stay long, which means most expect the price to rise again. 💸

There’s been no sign of shorts gaining control. This usually signals that buyers are willing to hold through volatility. 🌊
Funding rates are periodic payments made between long and short traders in perpetual futures. When rates are positive, longs are dominant and paying shorts, showing a bullish bias.
20/50 EMA Golden Crossover Confirms Uptrend
Solana recently saw the 20 EMA (exponential moving average) cross above the 50 EMA on the daily chart. This “golden crossover” is a bullish signal that suggests short-term momentum is picking up again. However, this crossover didn’t happen on a strong green candle; it came on a red candle with long wicks, showing some market indecision. 😕
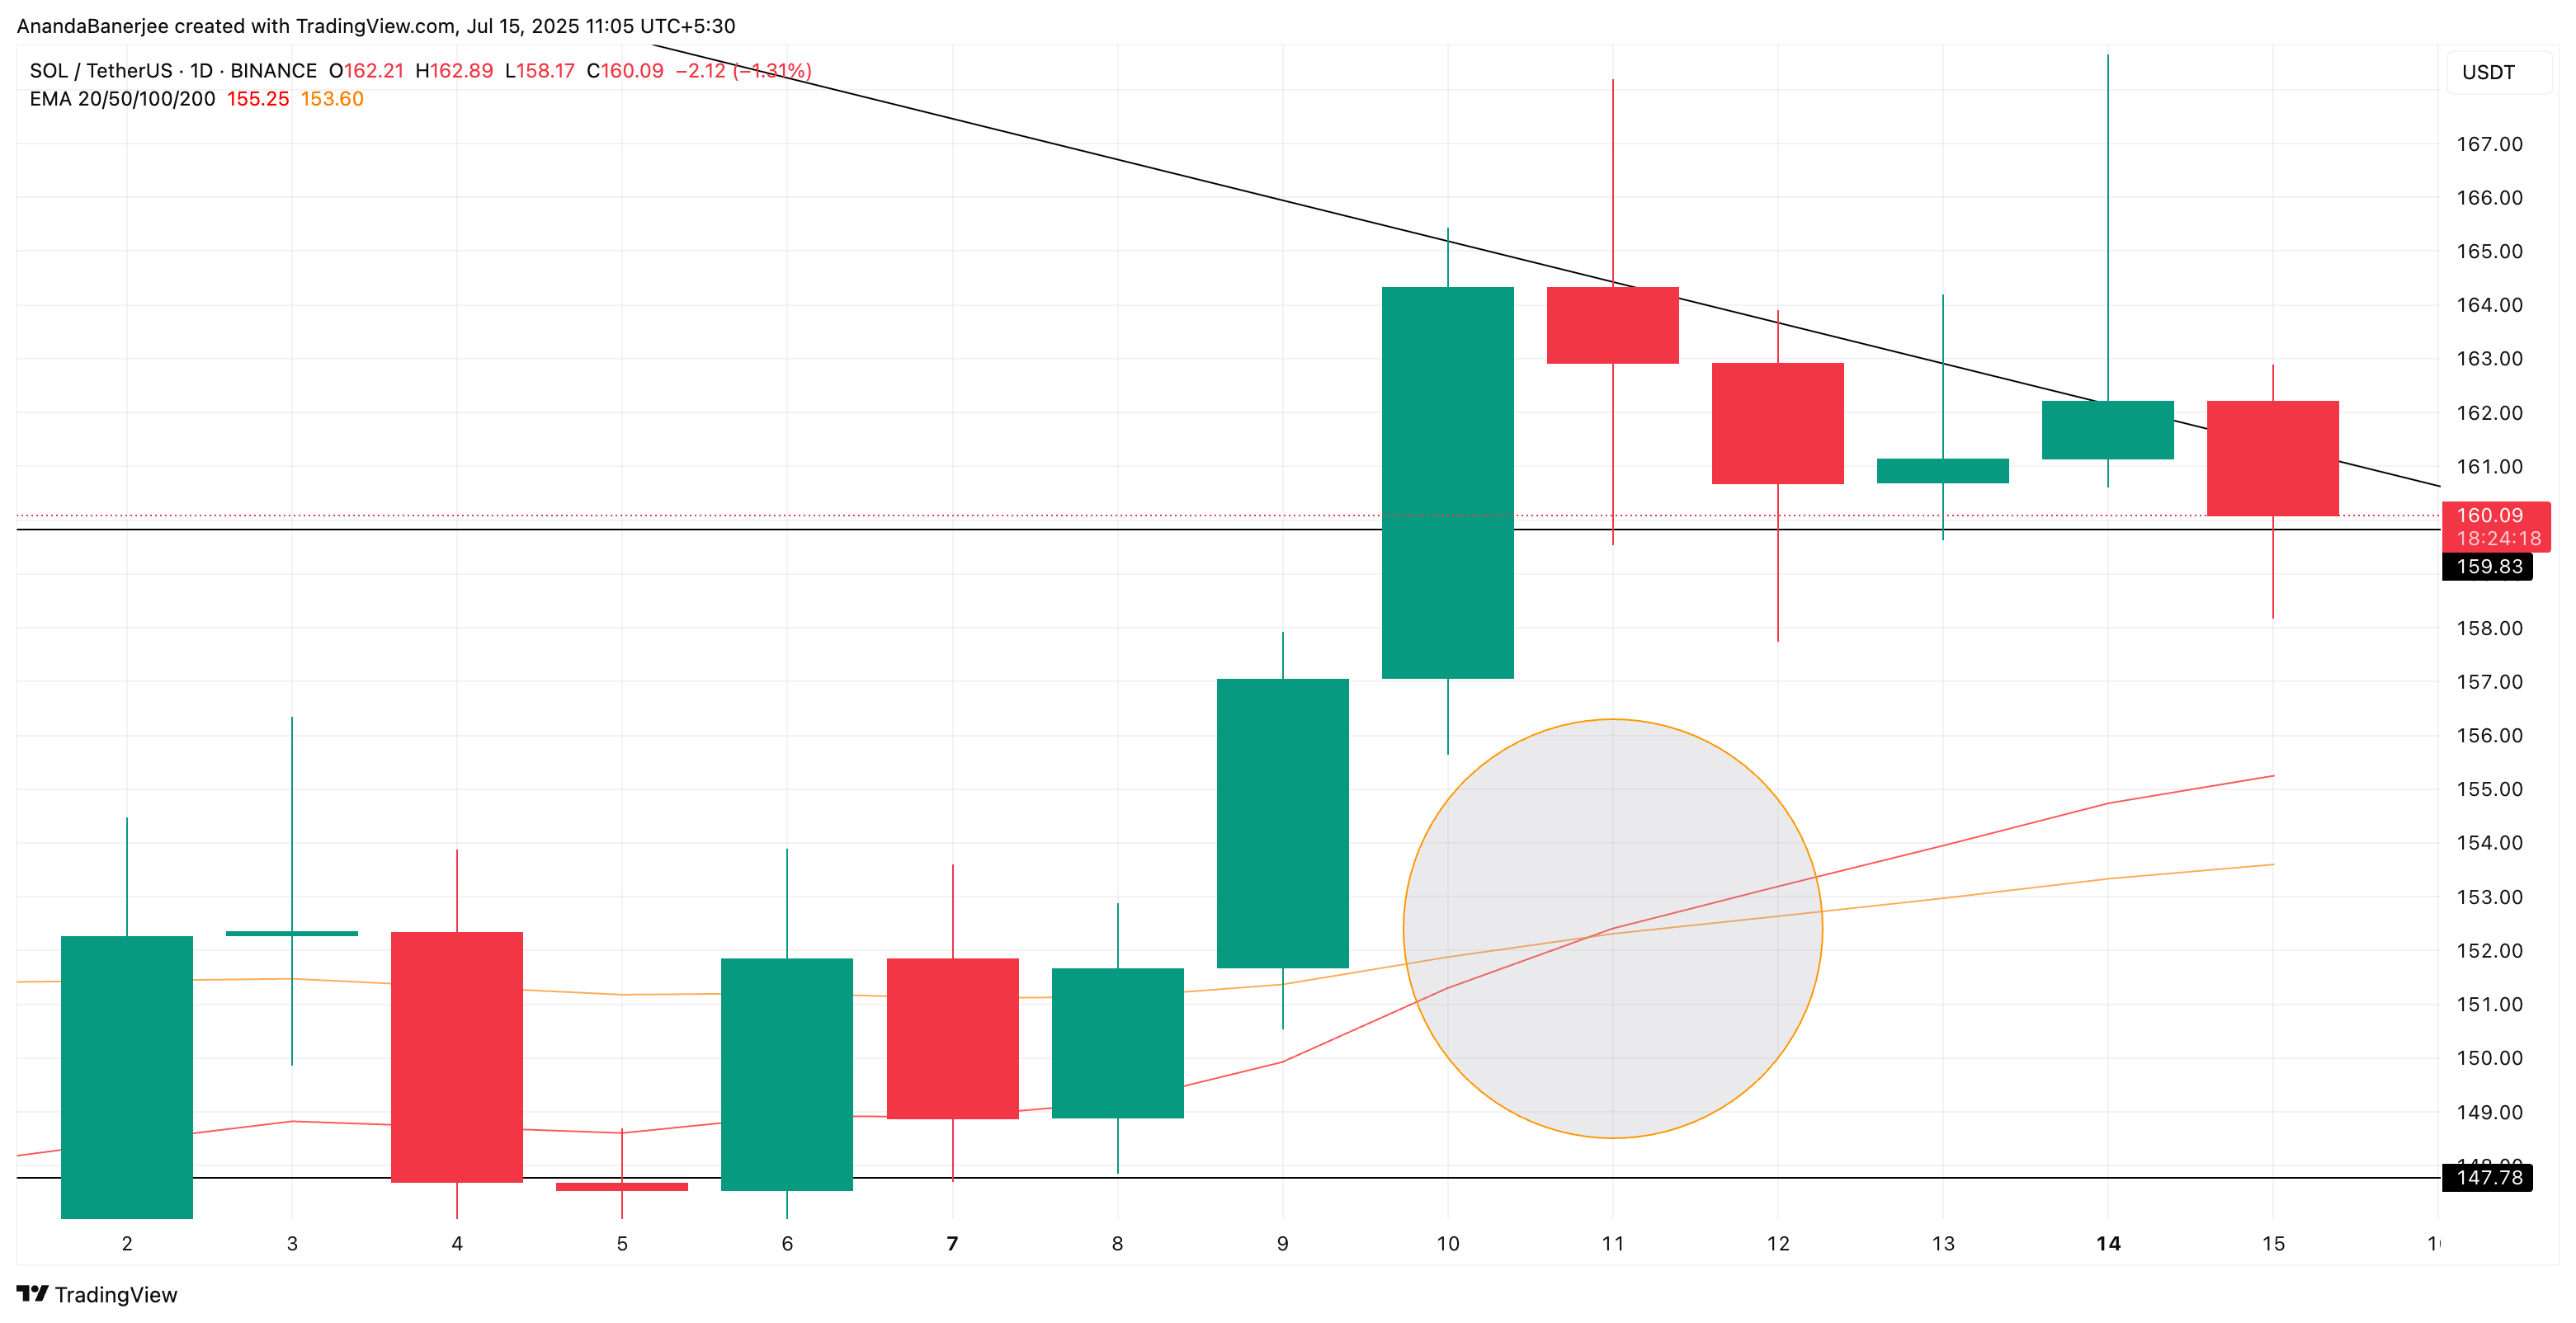
Still, this crossover supports the idea that the SOL price trend is shifting upward, even if the immediate momentum looks shaky. 🕵️♂️
Solana Price Still Above Key Support; Structure Intact
Despite the pullback to $160, Solana is still holding above a key support zone near $158, as projected by the Fibonacci retracement indicator, a tool useful for charting key support levels during an uptrend. 🔐
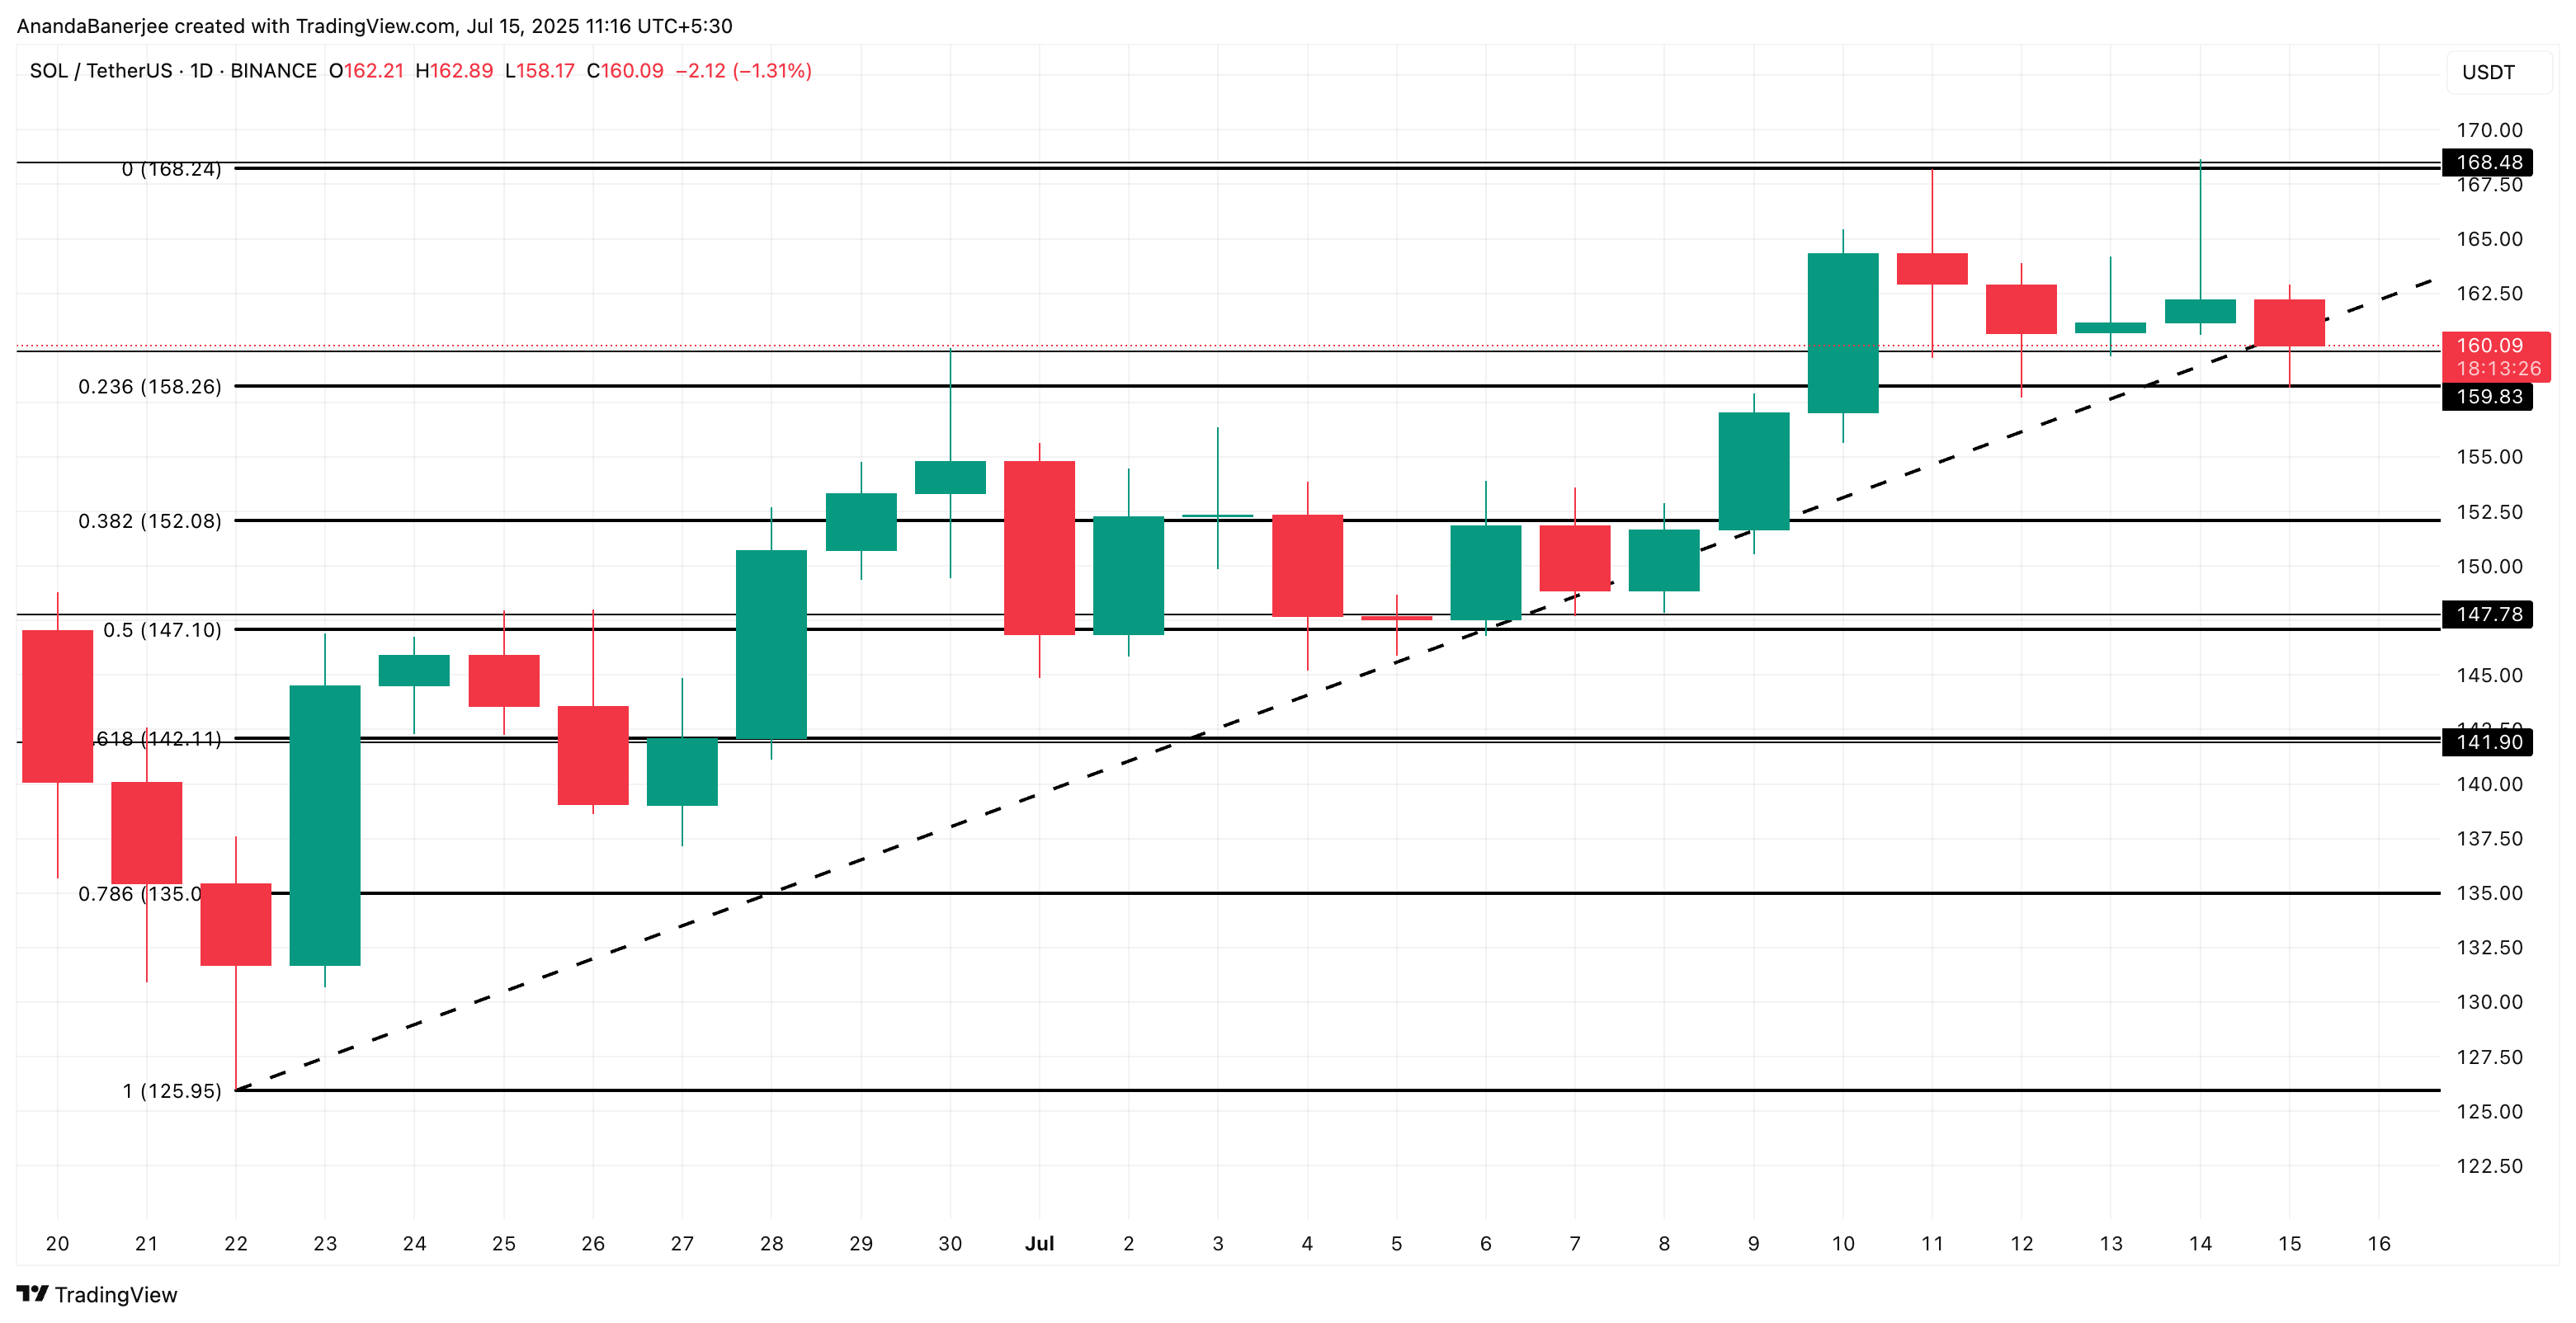
On the upside, if Solana reclaims $168, with funding rates continuing to stay positive, the next leg of the rally opens up. That would allow the SOL price to reach $179 and even $184 levels, provided the broader market sentiment remains bullish. 🚀
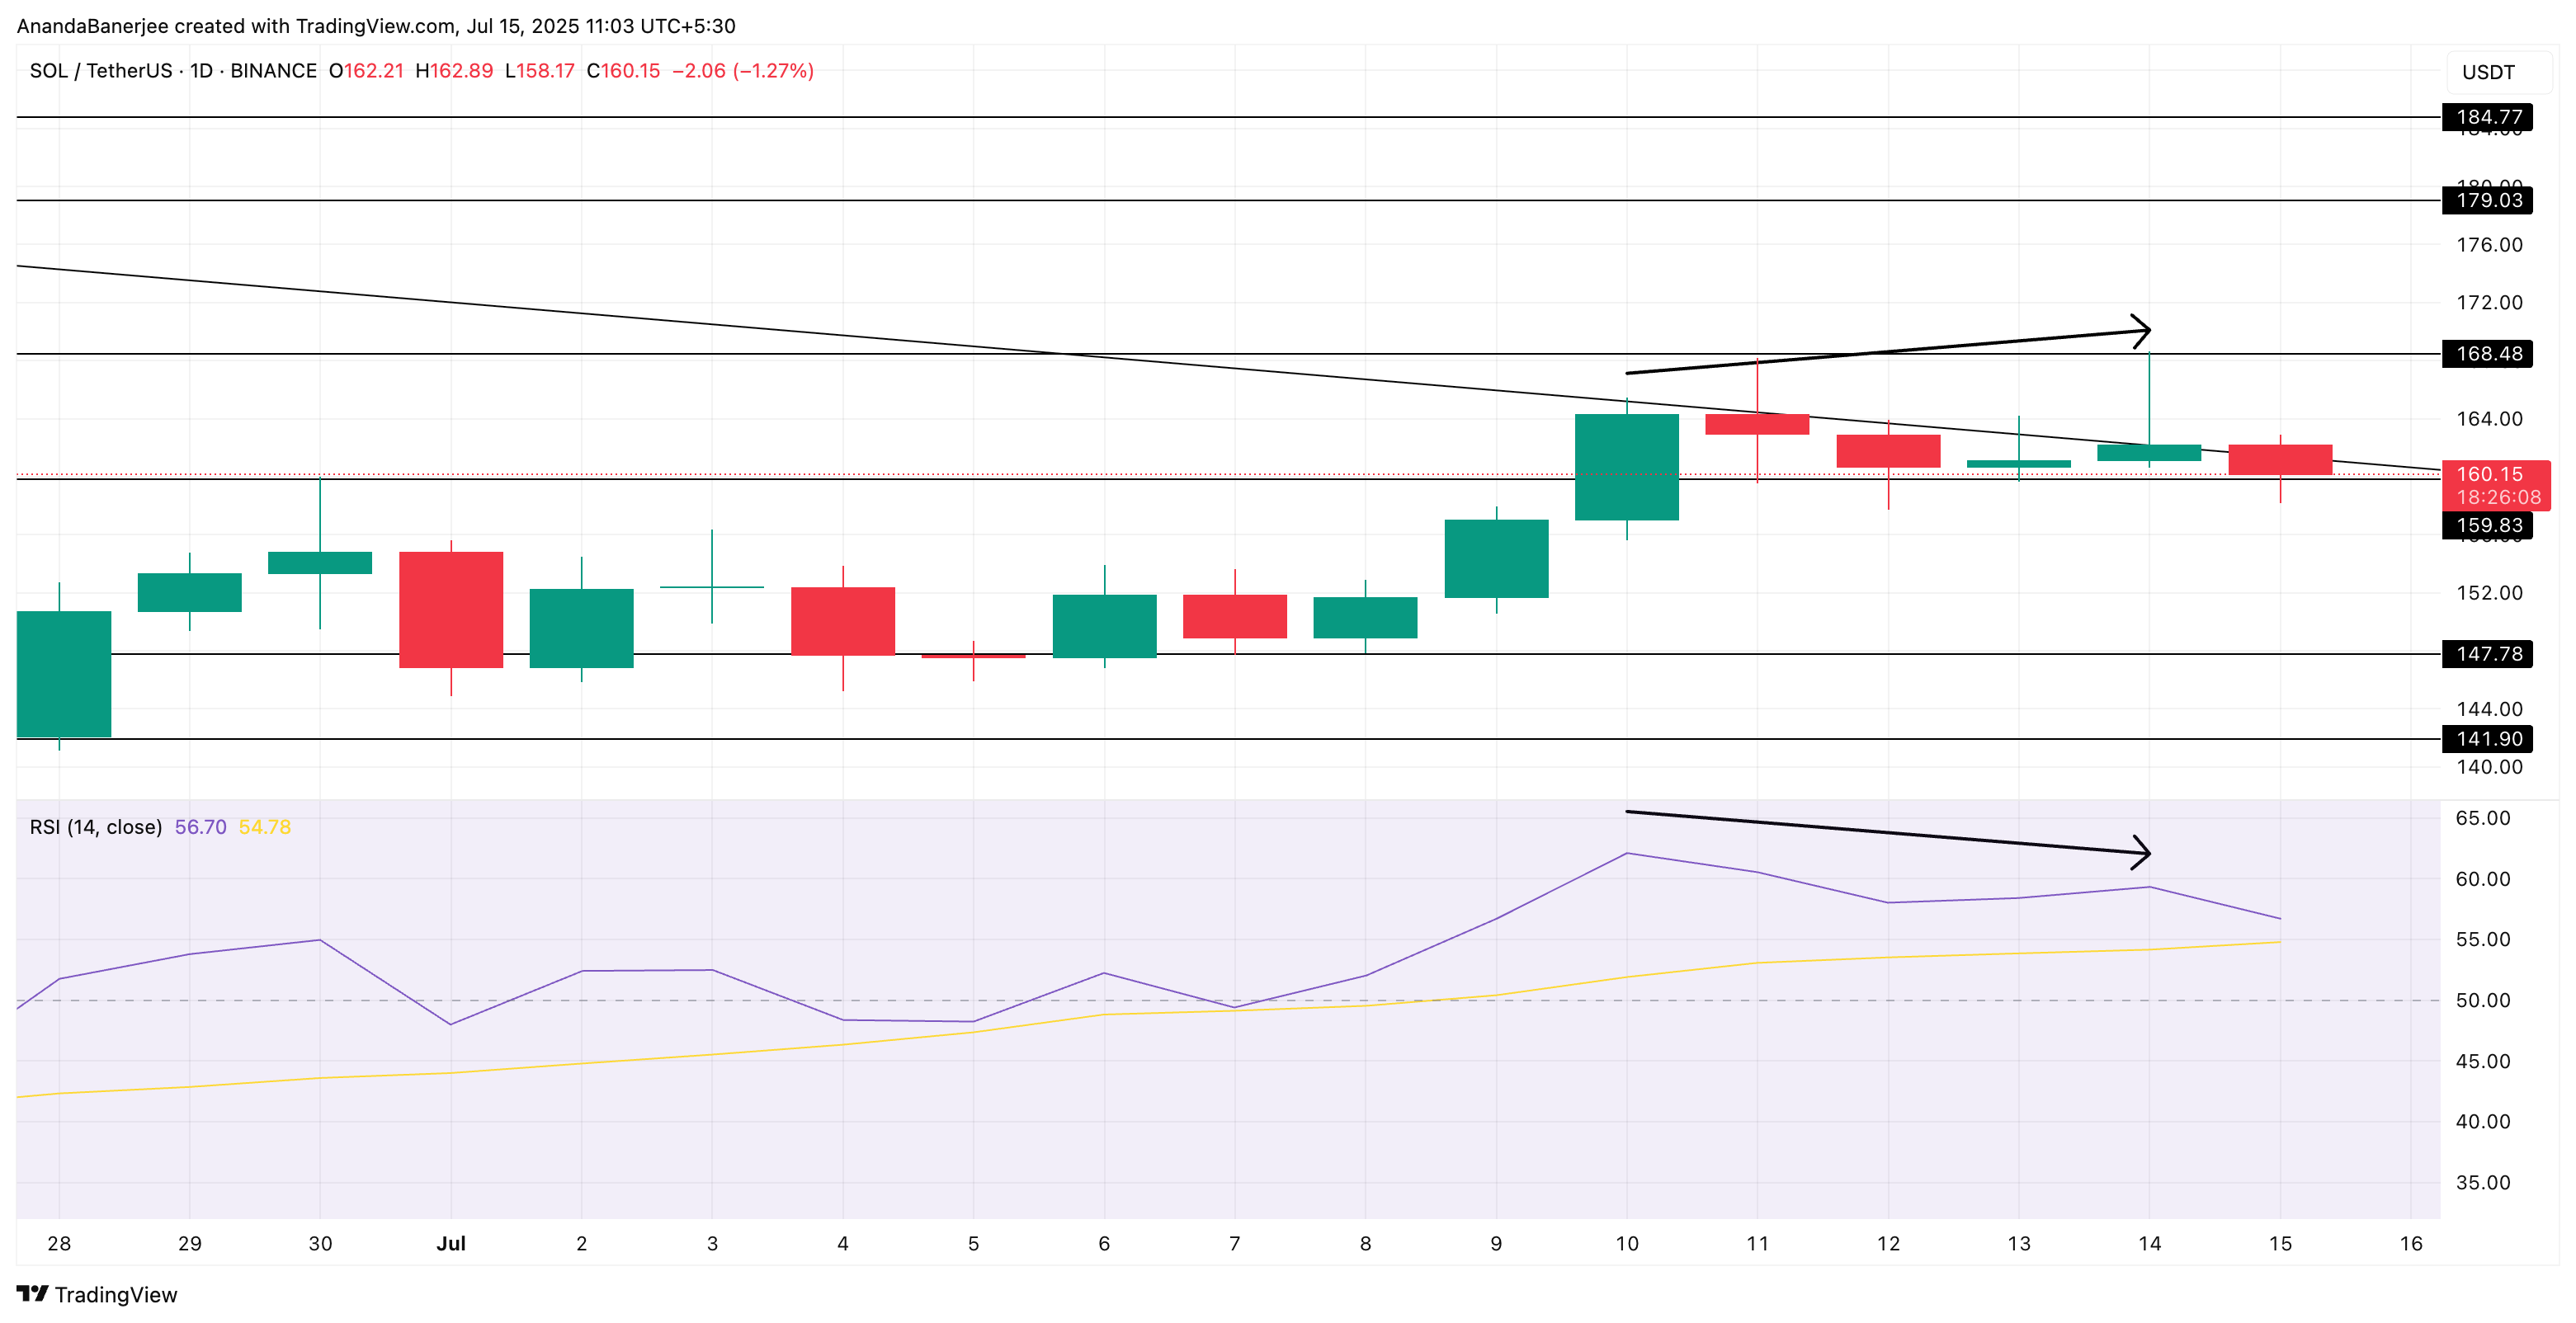
However, there’s a clear bearish RSI divergence between July 10 and July 14. The SOL price made a higher high, but the RSI made a lower high; a sign that momentum is weakening even as the SOL price pushes up. This divergence often leads to short-term corrections, which we’re seeing now. 📉
Also, RSI is starting to curve down after nearing its signal line, which adds to the case for temporary cooling. 🌡️
RSI (Relative Strength Index) is a momentum indicator that tracks how strong buying or selling pressure is. A divergence, when price rises but RSI falls, usually means momentum is fading. 🕵️♀️
The bearish RSI divergence, if followed by a dip below $158, could invalidate the broader bullish structure. And a correction to $152 (0.382 Fib level) or lower ($147) could flip the structure bearish in the short-to-mid timeframe. 🐻
Read More
- Pi Hotel Vietnam: First to Accept Pi Coin Payments in Real-World Transactions
- TAO PREDICTION. TAO cryptocurrency
- Brent Oil Forecast
- USD TRY PREDICTION
- EUR CNY PREDICTION
- EUR CLP PREDICTION
- ASTER PREDICTION. ASTER cryptocurrency
- USD ILS PREDICTION
- Charles Hoskinson Unveils Midnight: Privacy, Promises, and a Dash of Drama!
- JPY KRW PREDICTION
2025-07-15 12:18