Oh, the drama! Pi Coin has been flirting dangerously with a key support level, leaving traders on the edge of their seats. At the moment, the price stands at $0.4725, clinging to dear life above the $0.4452 mark.
While on-chain metrics aren’t exactly throwing a party, there are whispers of a potential shift in the bearish winds. 🐻
Open Interest and Funding Rate: A Pause for Thought?
Pi Coin seems to be having a bit of an identity crisis. Aggregated Open Interest on Coinalyze (in the 4-hour timeframe) is hovering around $10.09 million and has been rather indecisive over the past few days. This suggests that traders are not aggressively building new long or short positions, indicating a lack of conviction. 🤔

Meanwhile, the Aggregated Funding Rate climbed to +0.0274, and the Predicted Funding Rate spiked even higher to +0.0516. In layman’s terms, this means Pi Coin longs are slightly dominant and willing to pay a premium to hold their positions, which is usually a bullish sign. 🐂

Open Interest refers to the total number of unsettled contracts in the market. A rising Open Interest generally confirms that more traders are entering the market, supporting the current trend. Funding Rate is the periodic fee paid between long and short traders. Positive values mean longs are dominant; negative ones suggest shorts are in control.
Overall, the flat Open Interest with rising Funding Rates shows a mild long bias, but in the case of Pi Coin, it’s without strong conviction. 🤷♂️
Bear Power: Losing Its Grip?
With Funding Rates rising and Open Interest staying flat, the market leans slightly long but without conviction. This hesitation is mirrored in the Bull Bear Power indicator, part of the Elder Ray Index, which tracks the strength of buyers/sellers in the market.
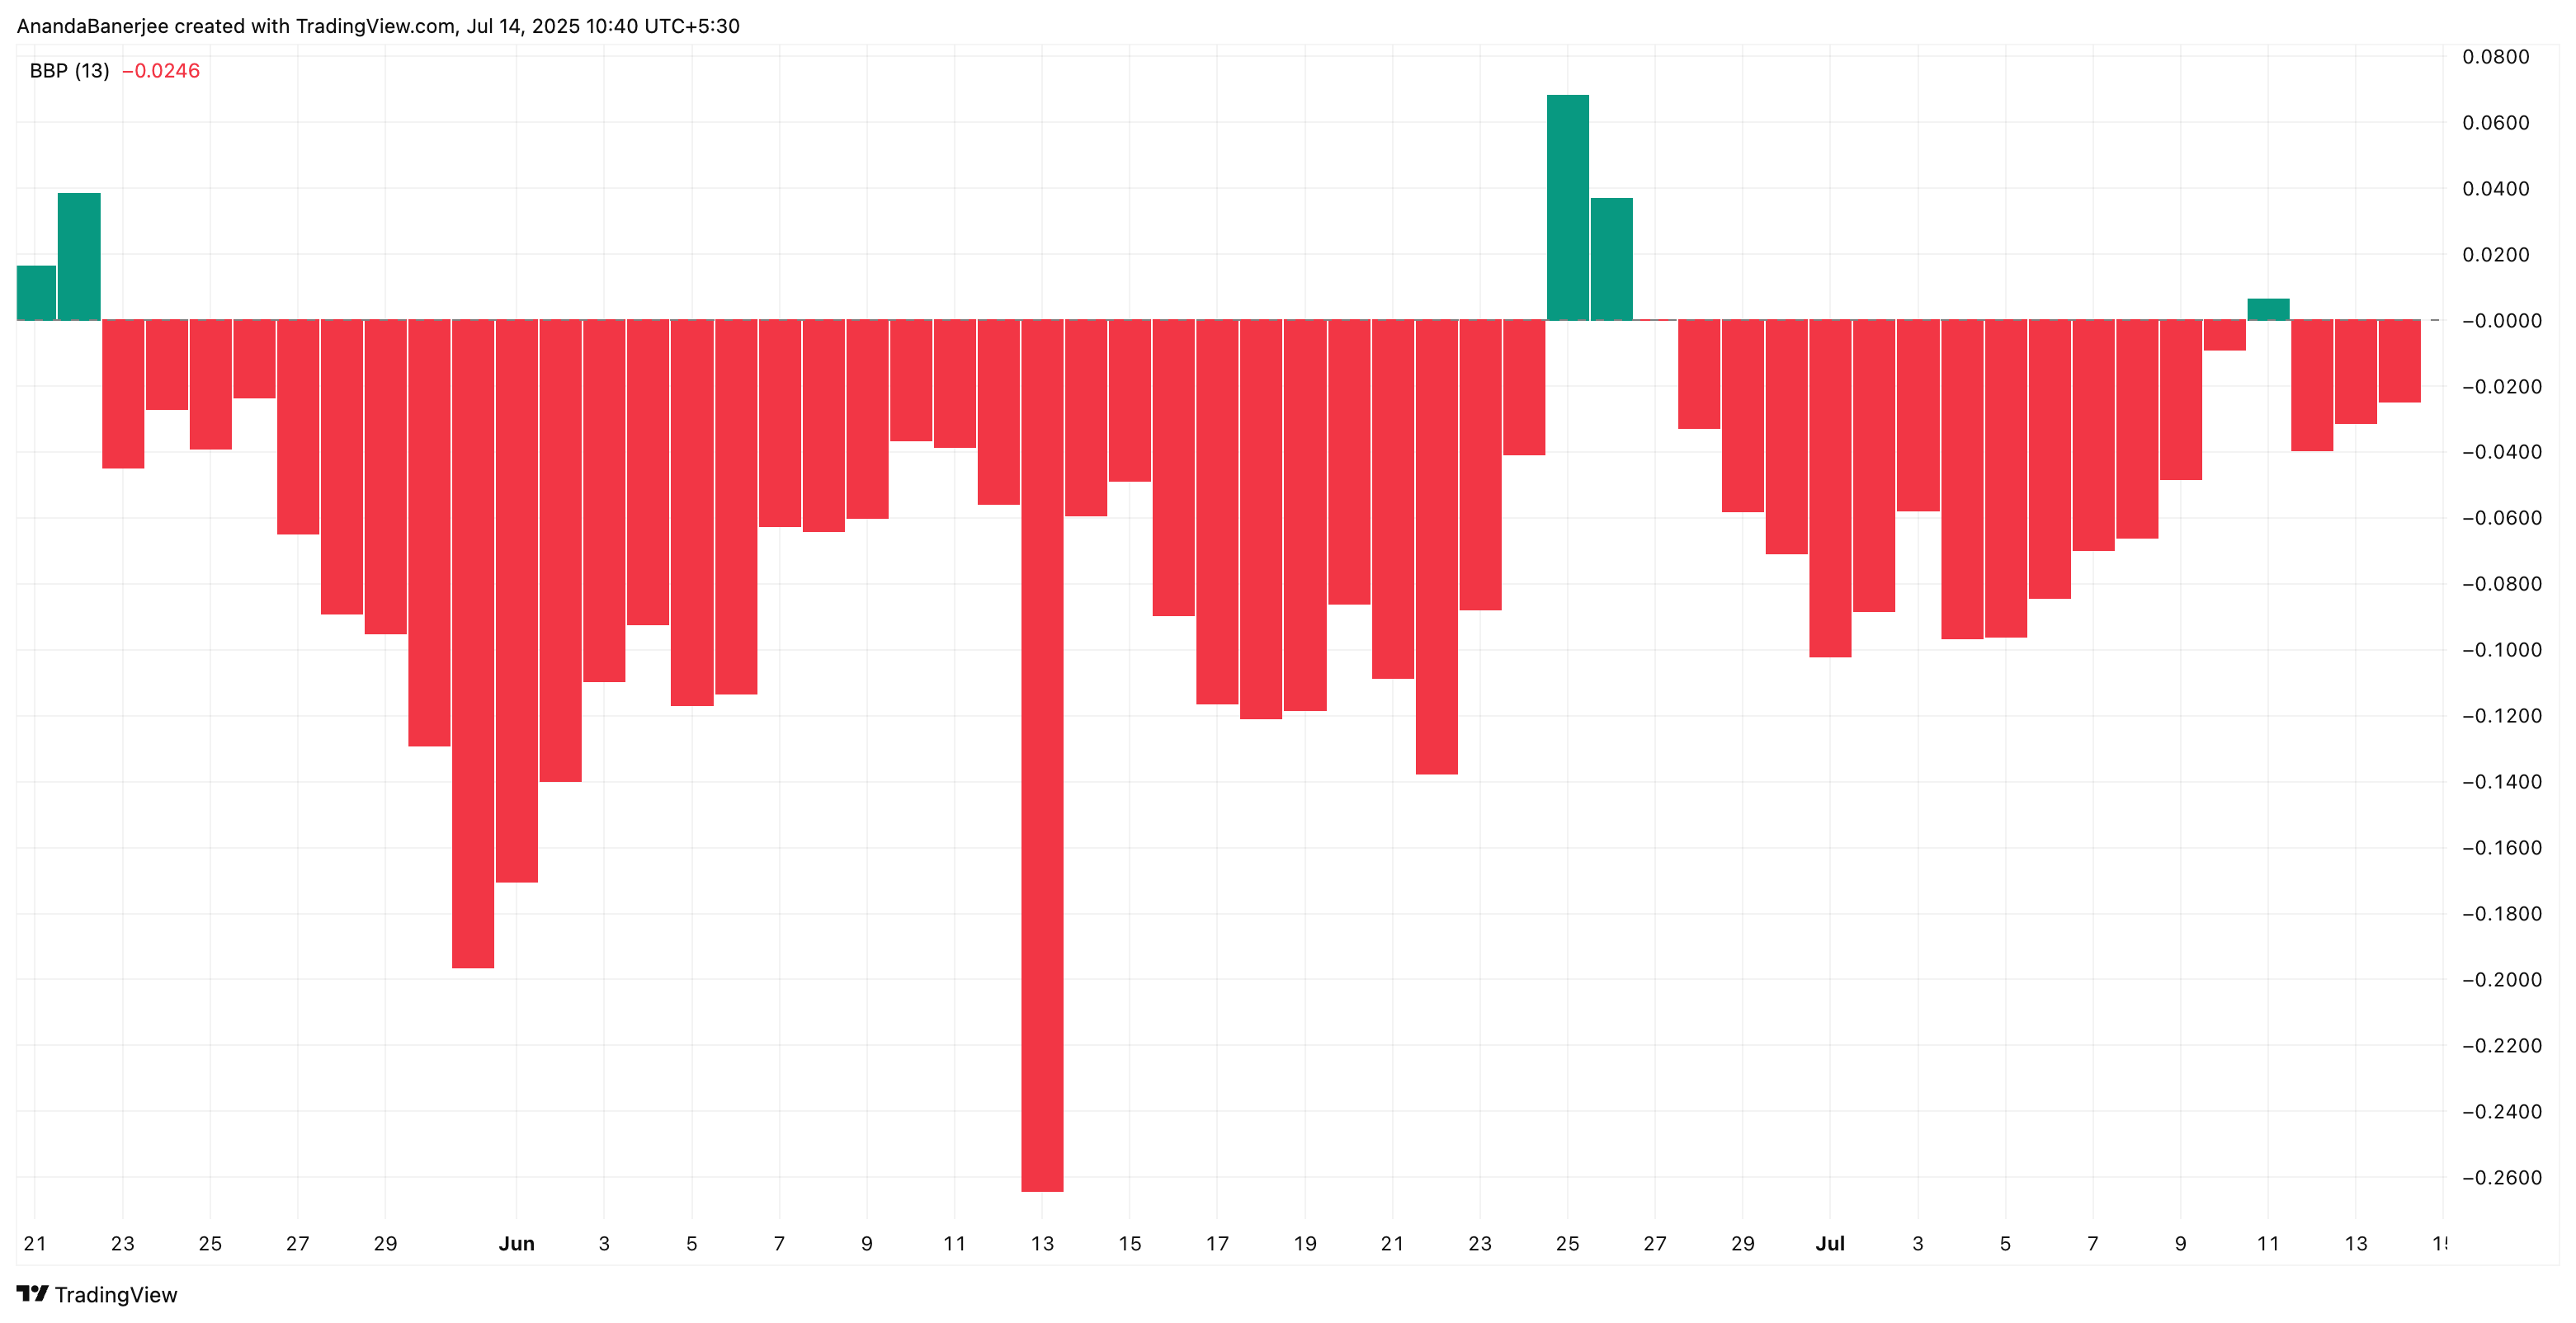
At the time of writing, Bear Power has continued to weaken, signaling that bearish momentum is fading. 🐻❄️
Pi Coin Price Analysis: Key Support Still Holding
Pi Coin (PI) is currently trading at $0.4725, just above the key support level at $0.4452. This level was derived using the Fibonacci retracement tool, drawn from the late June high to the July 6 low. 📈
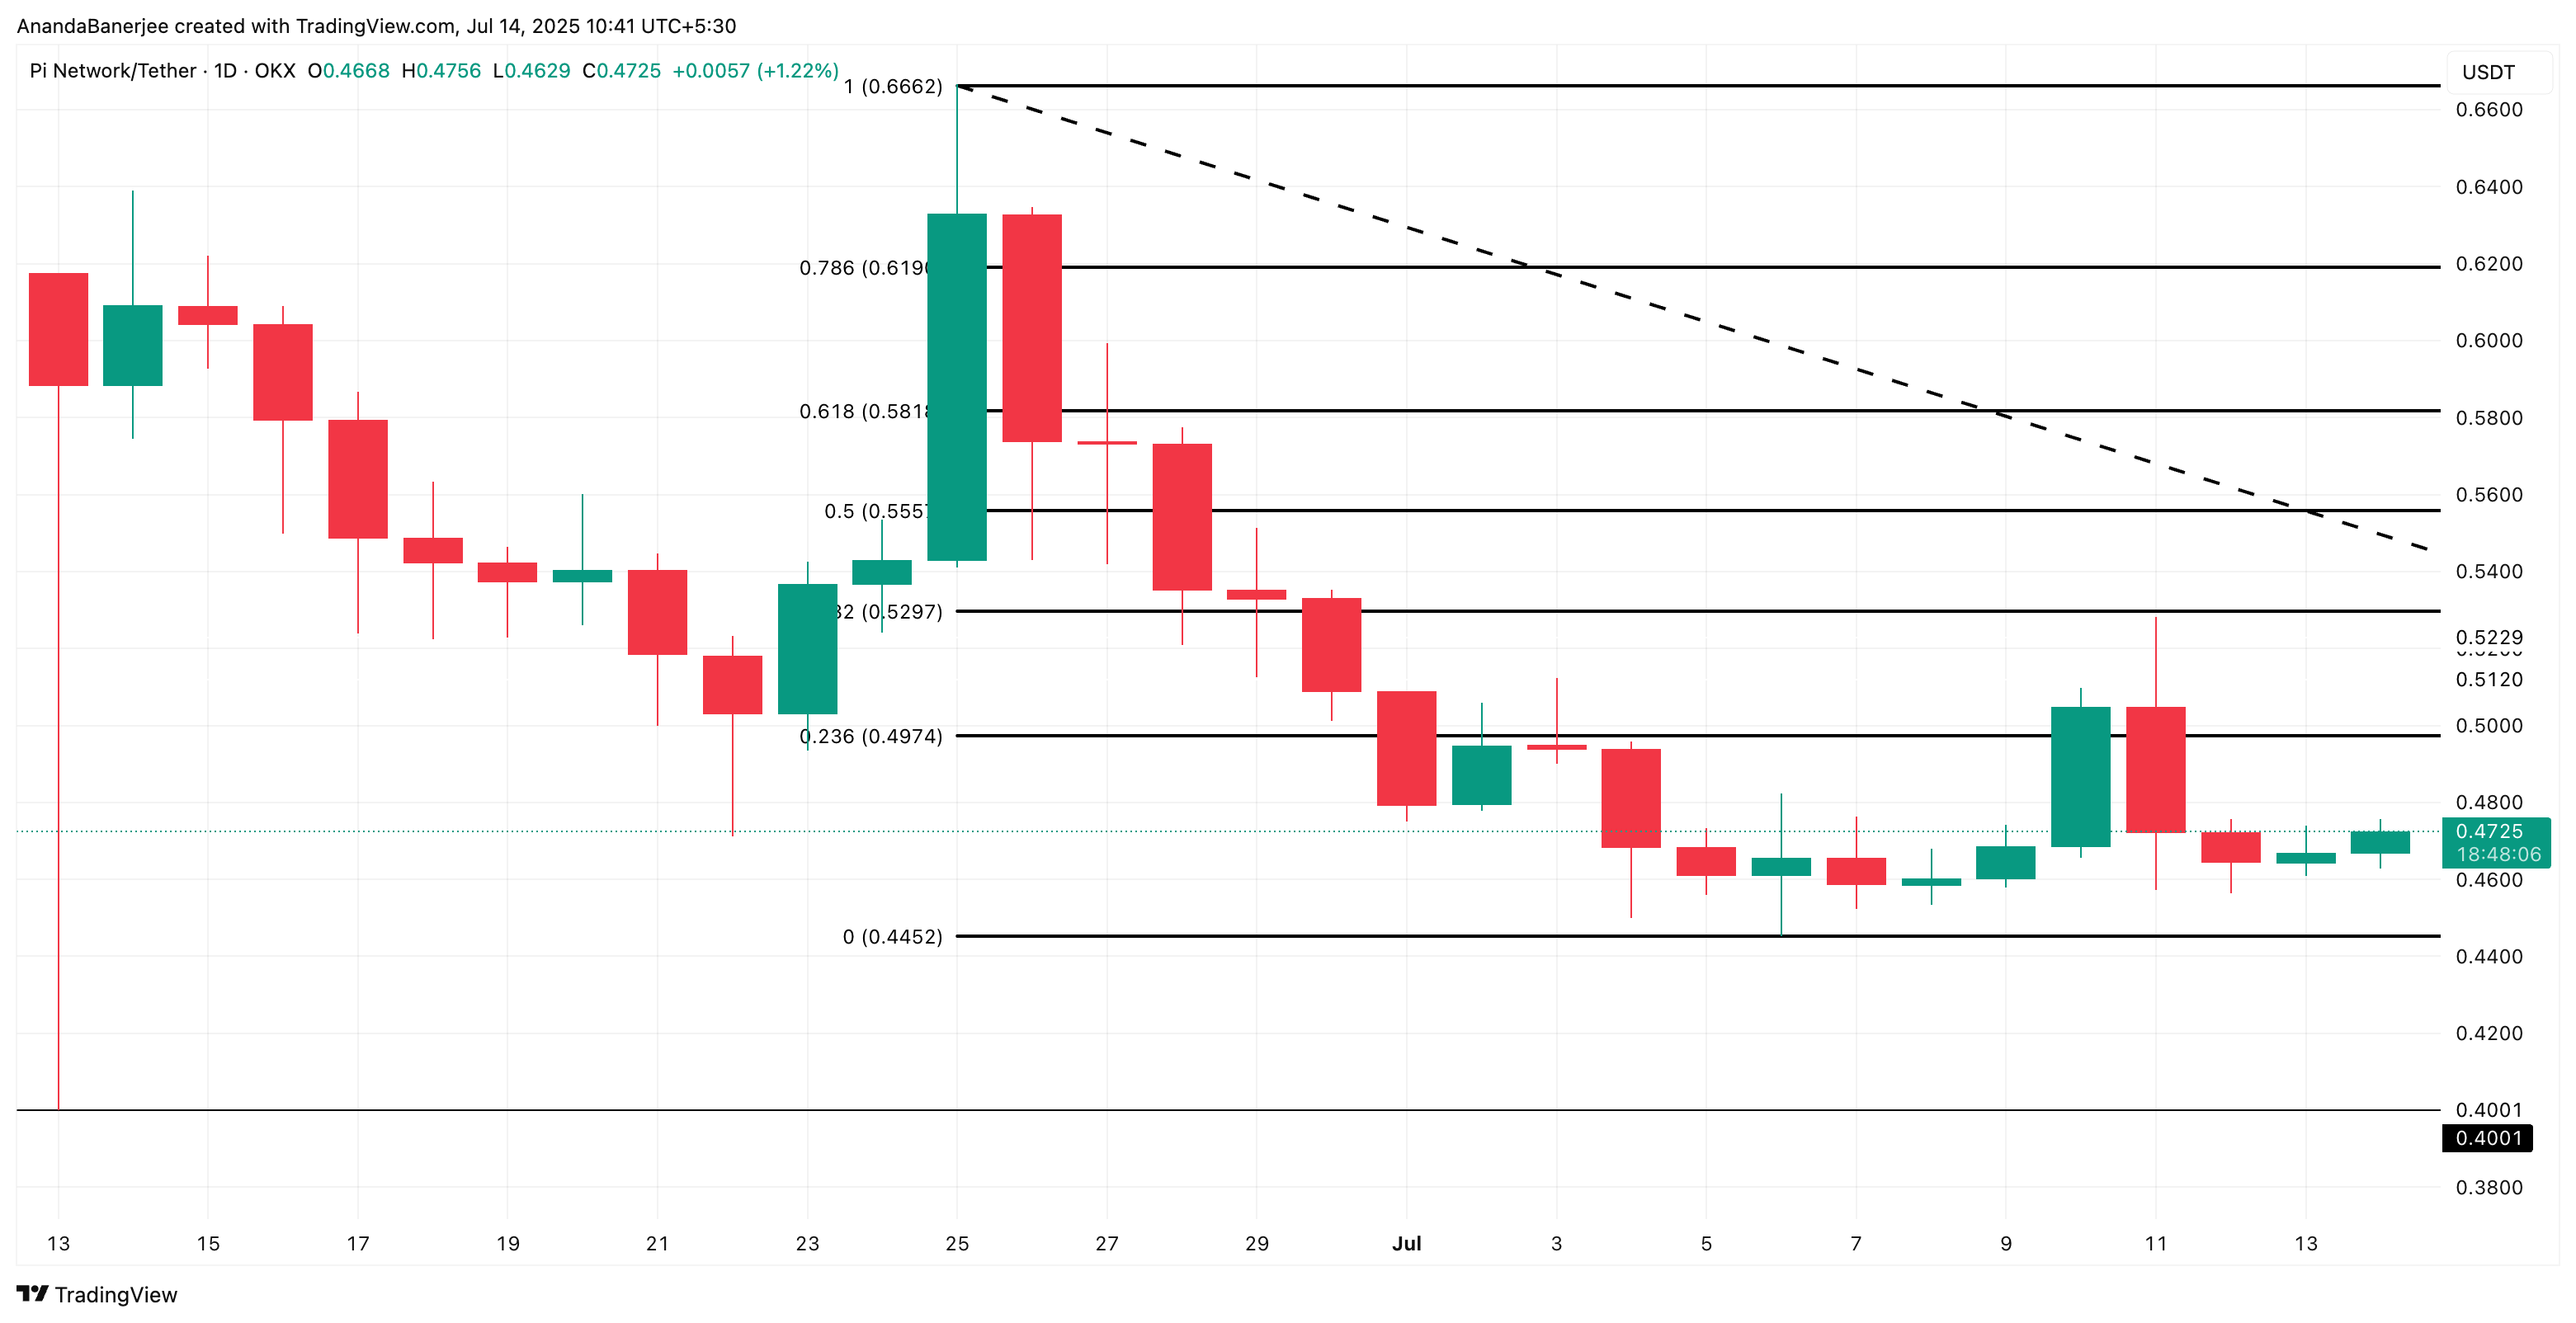
Fibonacci retracement is a technical tool traders use to identify potential support and resistance levels by measuring how far the price has pulled back from a recent move. 🔍
So far, this support has held despite Pi Coin’s broader downtrend. A breakdown below $0.4452 could expose Pi Coin to a sharper correction toward $0.4001, the next major support. 📉
On the flip side, if momentum builds, the next upside resistance is at $0.4974, a level where the PI price has been rejected a few times. A daily close above $0.4974 could flip the structure short-term bullish, invalidating the bearish hypothesis. 🐂
Read More
- Pi Hotel Vietnam: First to Accept Pi Coin Payments in Real-World Transactions
- TAO PREDICTION. TAO cryptocurrency
- USD TRY PREDICTION
- Silver Rate Forecast
- Brent Oil Forecast
- IP/USD
- EUR CLP PREDICTION
- EUR CNY PREDICTION
- PI PREDICTION. PI cryptocurrency
- Saudi’s Hidden Treasure: 11 Million Tonnes of Gold, Silver & More! 🏴☠️
2025-07-14 12:06