Bitcoin’s sitting at a cozy $104,391 as of June 2, 2025. With a market cap of $2.074 trillion, it’s got some serious clout—like the prom queen of the crypto world. Its 24-hour trading volume? A casual $20.70 billion. For those playing the ‘how low can you go?’ game, Bitcoin bounced around between $103,939 and $105,804. Talk about a tightrope walk—just a little wobbly, but not falling yet.
Bitcoin: More Drama Than a Soap Opera
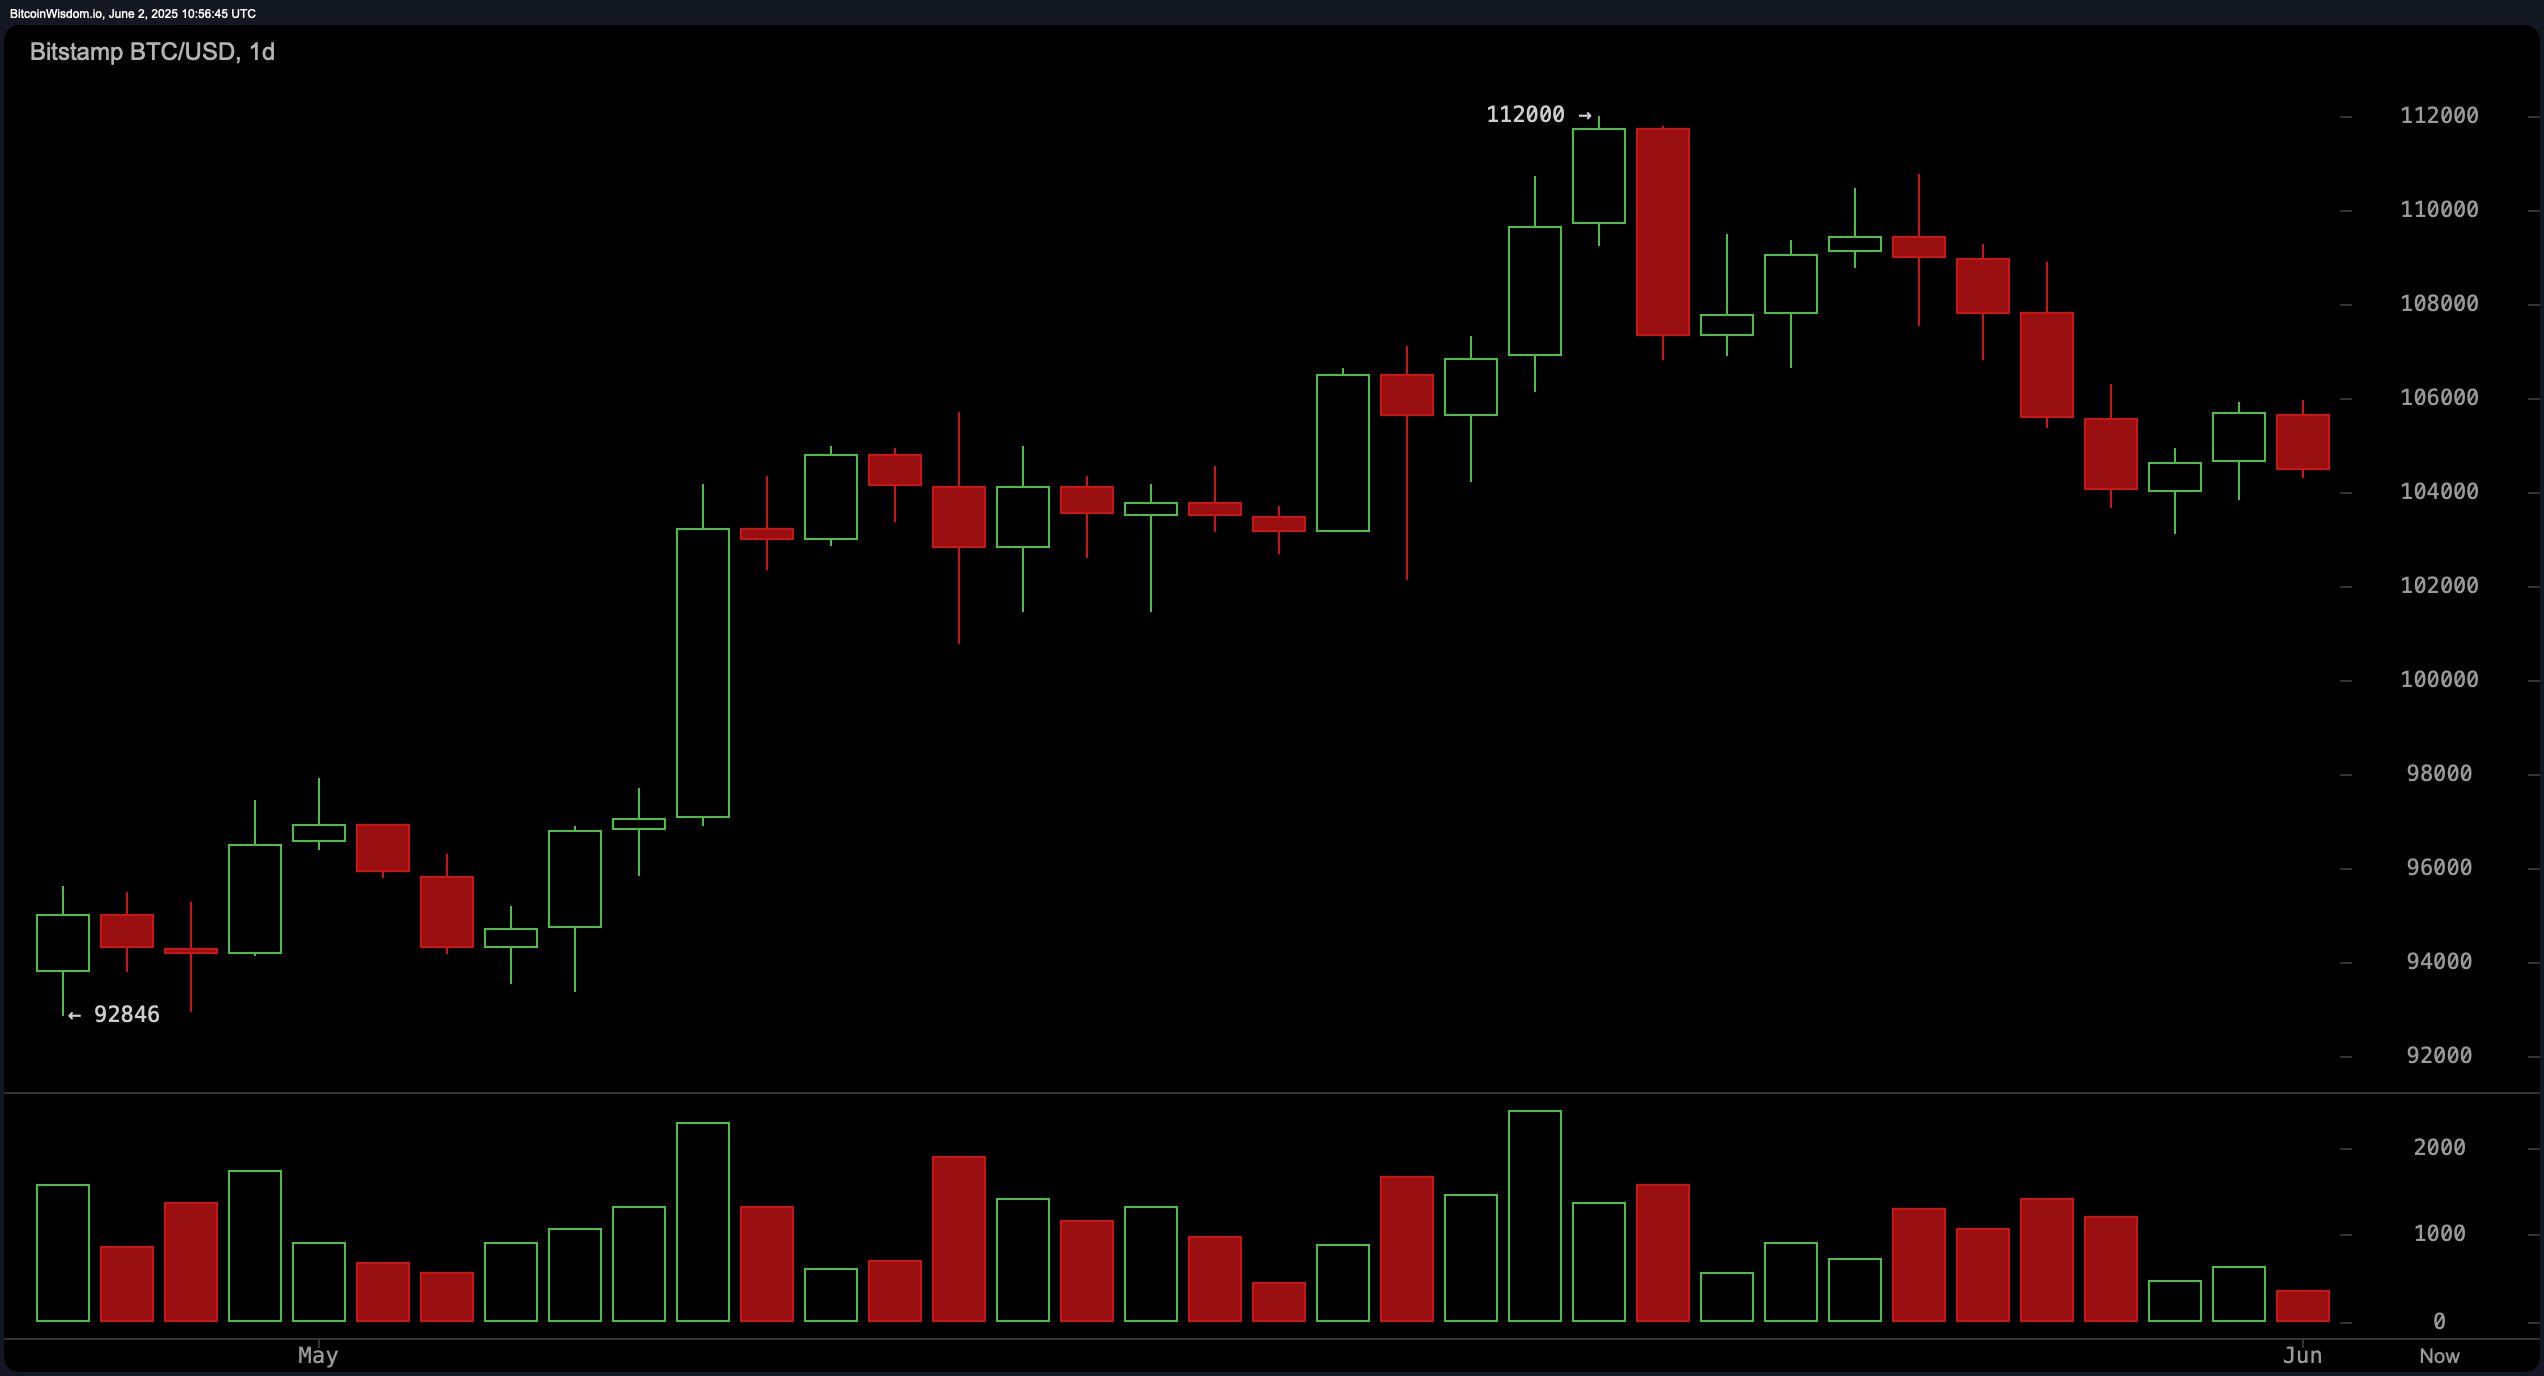
Here’s the latest on Bitcoin: it’s taking a little breather after hitting a $112,000 high in May. Like any drama queen, it’s been pulling back, but let’s be real, it’s not exactly losing its sparkle just yet. The market volume’s dropping, which might be a sign that people are tired of selling. A support zone’s forming between $103,500 and $104,000. If the bulls get their act together, they could storm back in. Meanwhile, resistance levels are scattered like landmines—$108,000, $110,000, $112,000—take your pick. Traders are clearly waiting for some sort of miracle. Hold your breath for a reversal or just keep holding your wallet tight.
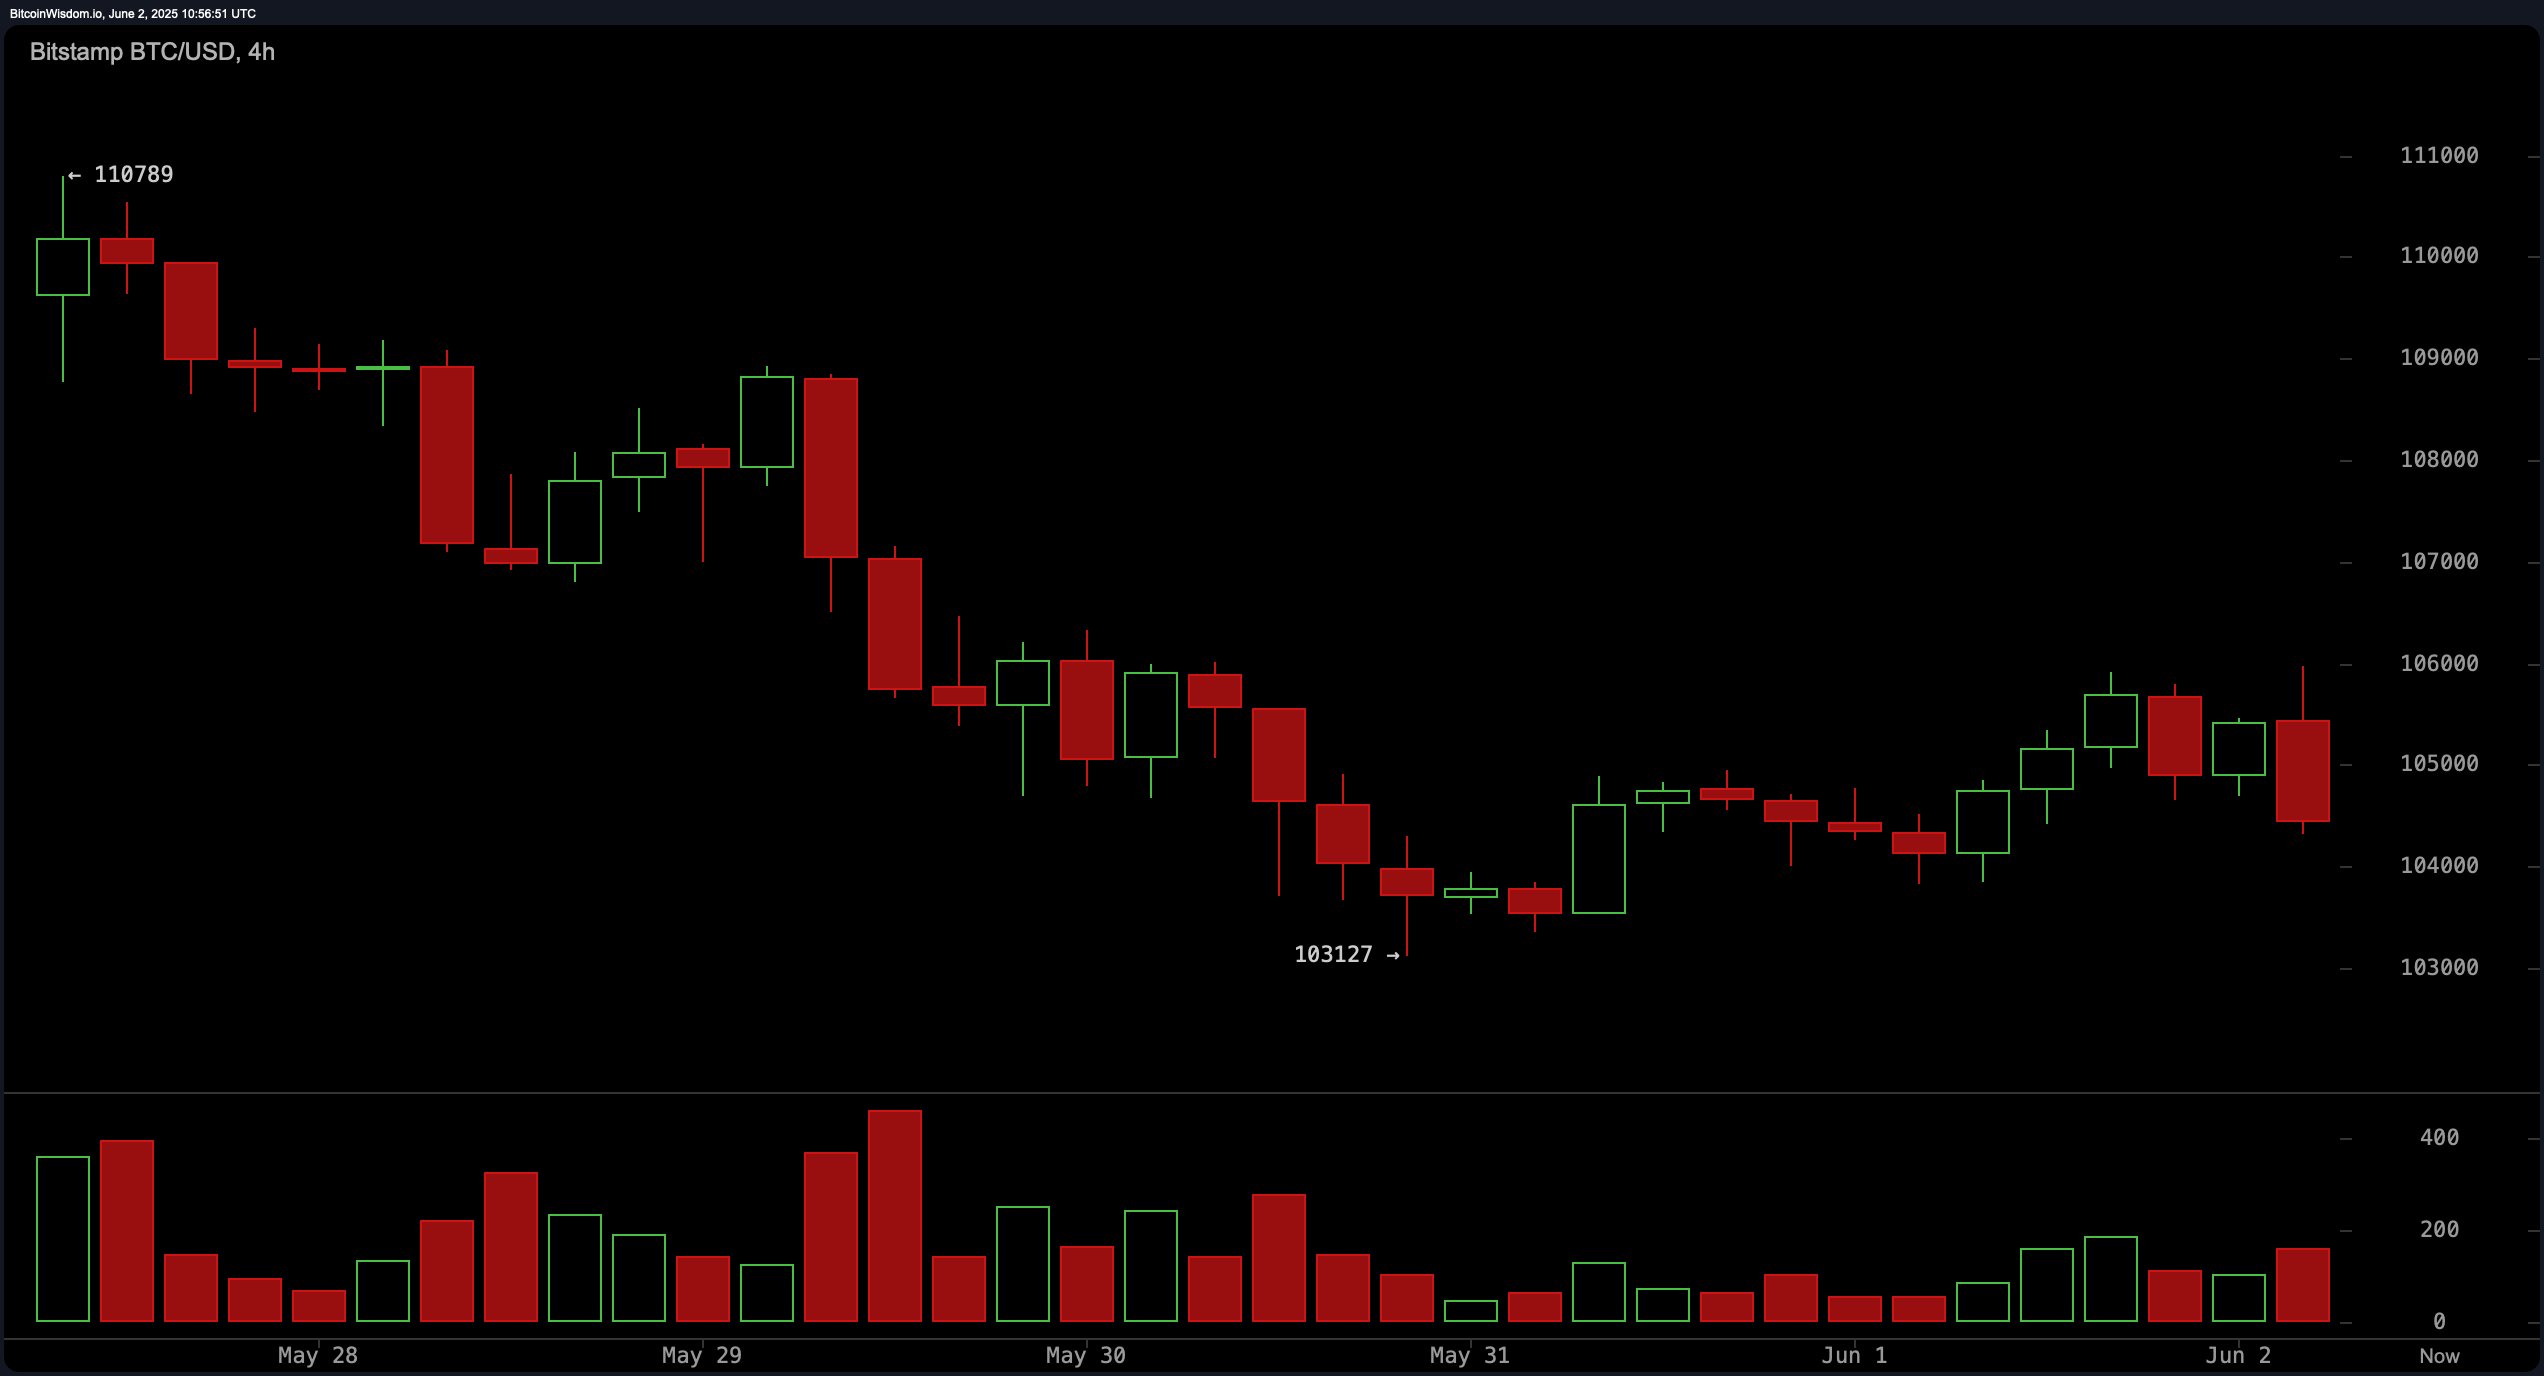
Let’s take a detour to the four-hour chart. Bitcoin’s playing hard-to-get, refusing to break resistance at $105,500–$106,000. A bearish engulfing pattern just showed up to remind everyone it’s still got its edge. The RSI is hanging out at 51, and the ADX is at 22—so basically, the market’s confused, like that one friend who can never decide where to eat. Consider shorting near resistance, but don’t forget to run for cover if it all falls apart toward $103,500. The suspense is real.
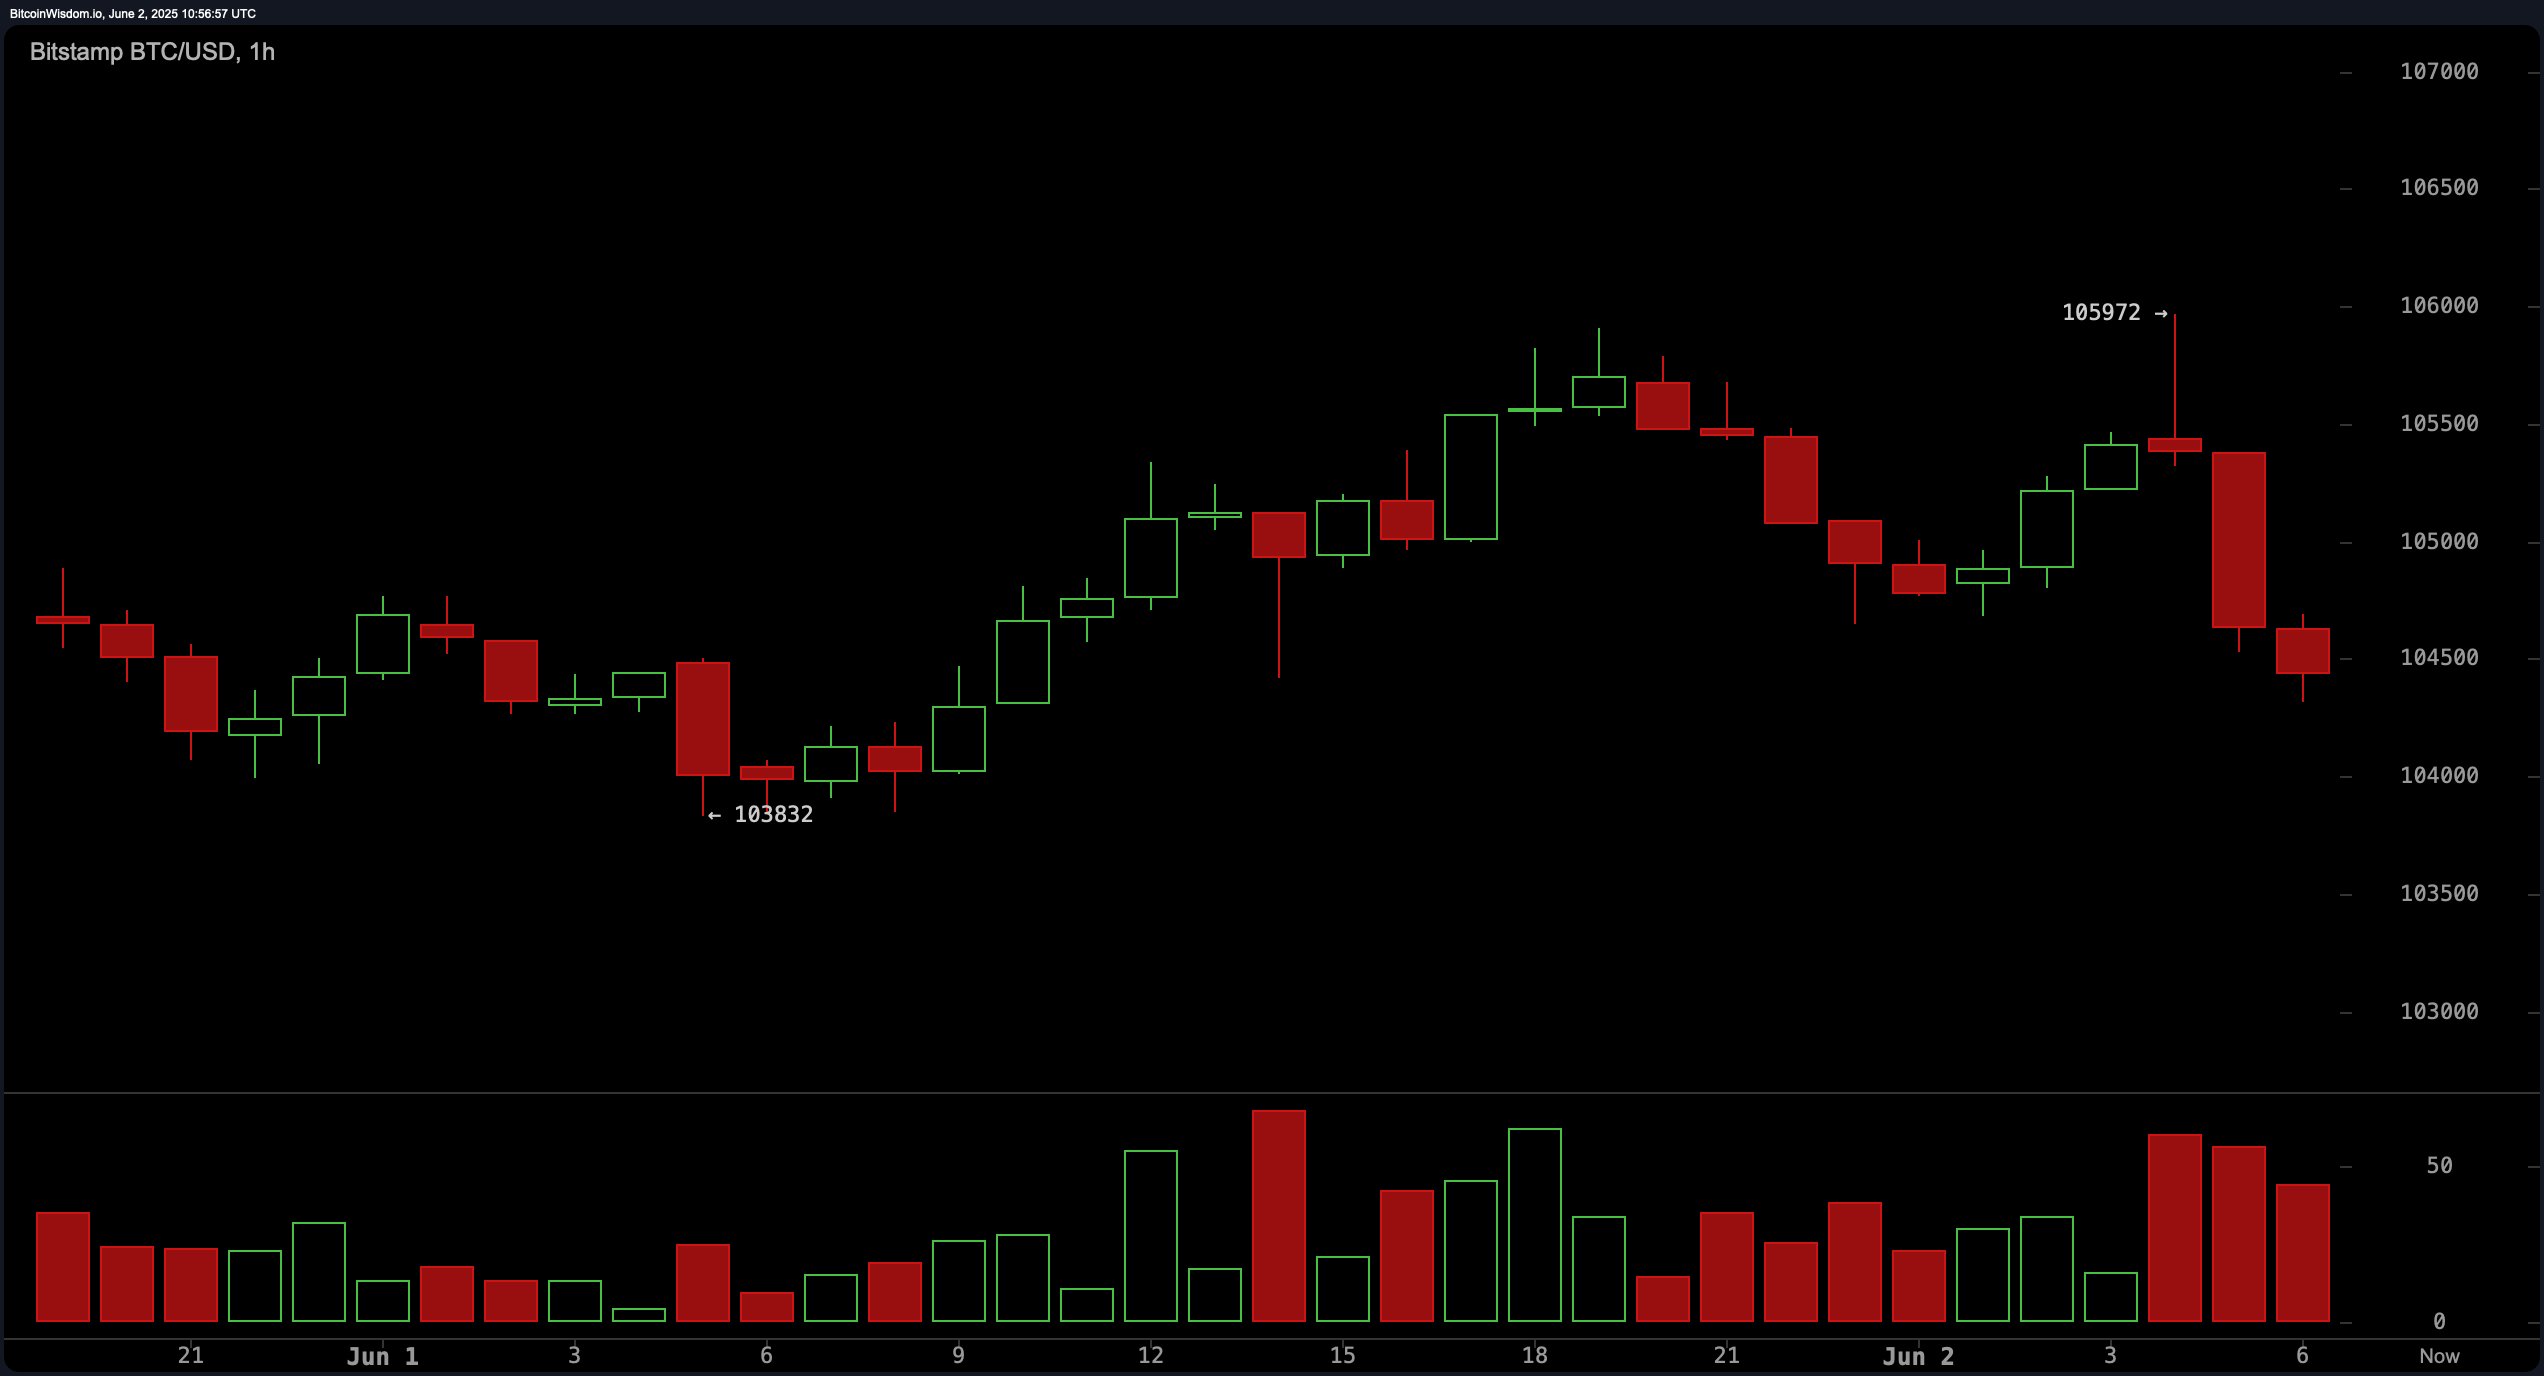
Now, the one-hour chart? Well, it’s got a double top pattern, which, if you’re a chart geek, is a bit like that moment when your ex shows up at the same party: awkward. Bitcoin’s flirting with $105,900, but then—bam—rejected at $105,972. Classic. The volume’s red, which screams ‘SELL’ at full volume. Support sits at $103,800, but if that breaks? Say hello to a freefall towards $102,800. Not exactly a thrilling ride unless you’re into high-risk excitement. Oh, and the momentum indicator? -2,835—yep, definitely oversold. Can anyone say ‘bounce back’?
Oscillator analysis is a big fat “meh” right now. RSI, stochastic %K, and others are all just hanging out in neutral territory. Meanwhile, the momentum indicator’s giving out a buy signal—talk about mixed signals. It’s like dating someone who can’t decide if they like you or just want your fries. The moving averages, as usual, have conflicting opinions. Short-term MAs are still saying ‘sell,’ but the longer ones are all ‘nope, we’re still bullish.’ Classic case of split personalities.
In case you missed it, moving averages are basically the split personalities of the crypto world. The 10 and 20-period MAs are flashing red, but the 30, 50, 100, and 200-periods are still waving their “uptrend” flags. This might mean Bitcoin’s in a holding pattern, like a plane circling the airport but too scared to land. Get ready for the next move, but who knows when that will be?
Bull Verdict (Hold Your Horses):
Look, Bitcoin’s not dead yet. The long-term outlook is still positive, with support near $104,000 holding strong. If the bulls wake up from their nap and volume gets a boost, it might head back toward $108,000–$110,000. Maybe. It’s like waiting for your favorite show to come back from hiatus—one can only hope.
Bear Verdict (Here’s the Real Talk):
But—plot twist—the short-term outlook looks pretty bleak. The bears are winning, with lower highs and rejections at key levels. If Bitcoin doesn’t get its act together and reclaim $106,000, brace yourself for a potential drop to $103,000 or lower. Volume’s the wildcard, so don’t get too comfy. Think of it as the crypto equivalent of sitting on the edge of your seat during a horror movie.
Read More
- Pi Hotel Vietnam: First to Accept Pi Coin Payments in Real-World Transactions
- TAO PREDICTION. TAO cryptocurrency
- USD TRY PREDICTION
- Brent Oil Forecast
- EUR CNY PREDICTION
- EUR NZD PREDICTION
- EUR CLP PREDICTION
- USD ILS PREDICTION
- PI PREDICTION. PI cryptocurrency
- JPY KRW PREDICTION
2025-06-02 15:33