Bitcoin took a nosedive this year—dropping 23% since January—putting it firmly in the bear market club. It’s like that one friend who vows to “take it easy” after New Year’s and then immediately orders extra fries.
On Good Friday, Bitcoin was trading at a modest $84,555. Up 13% from its annual low, which somehow translates to a market cap north of $1.68 trillion. Basically, enough to buy… well, a lot of Lambos. Despite a 10% loss for 2025, Bitcoin’s holding its own better than the Nasdaq 100 index, which slipped 13%. So, it’s the financial equivalent of that kid who got a B+ while everyone else flunked.
History tells us this isn’t Bitcoin’s first rodeo—or its first headfirst plunge. It once tanked 35% from March to August of last year. Then, like a caffeine-fueled cat, it bounced back. It’s seen worse.
Remember November 2021? Bitcoin dropped from $68,980 to a “what do you mean there’s a recession?” low in 2022. Thanks, Federal Reserve rate hikes and spectacular disasters like Celsius, Terra, and FTX blowing up—crypto’s version of a soap opera.
So yeah, it might dip a bit more. But the fundamentals aren’t playing dead just yet. Mining difficulty hit an all-time high, which means fewer freshly minted coins are crowding the party. Scarcity, baby.
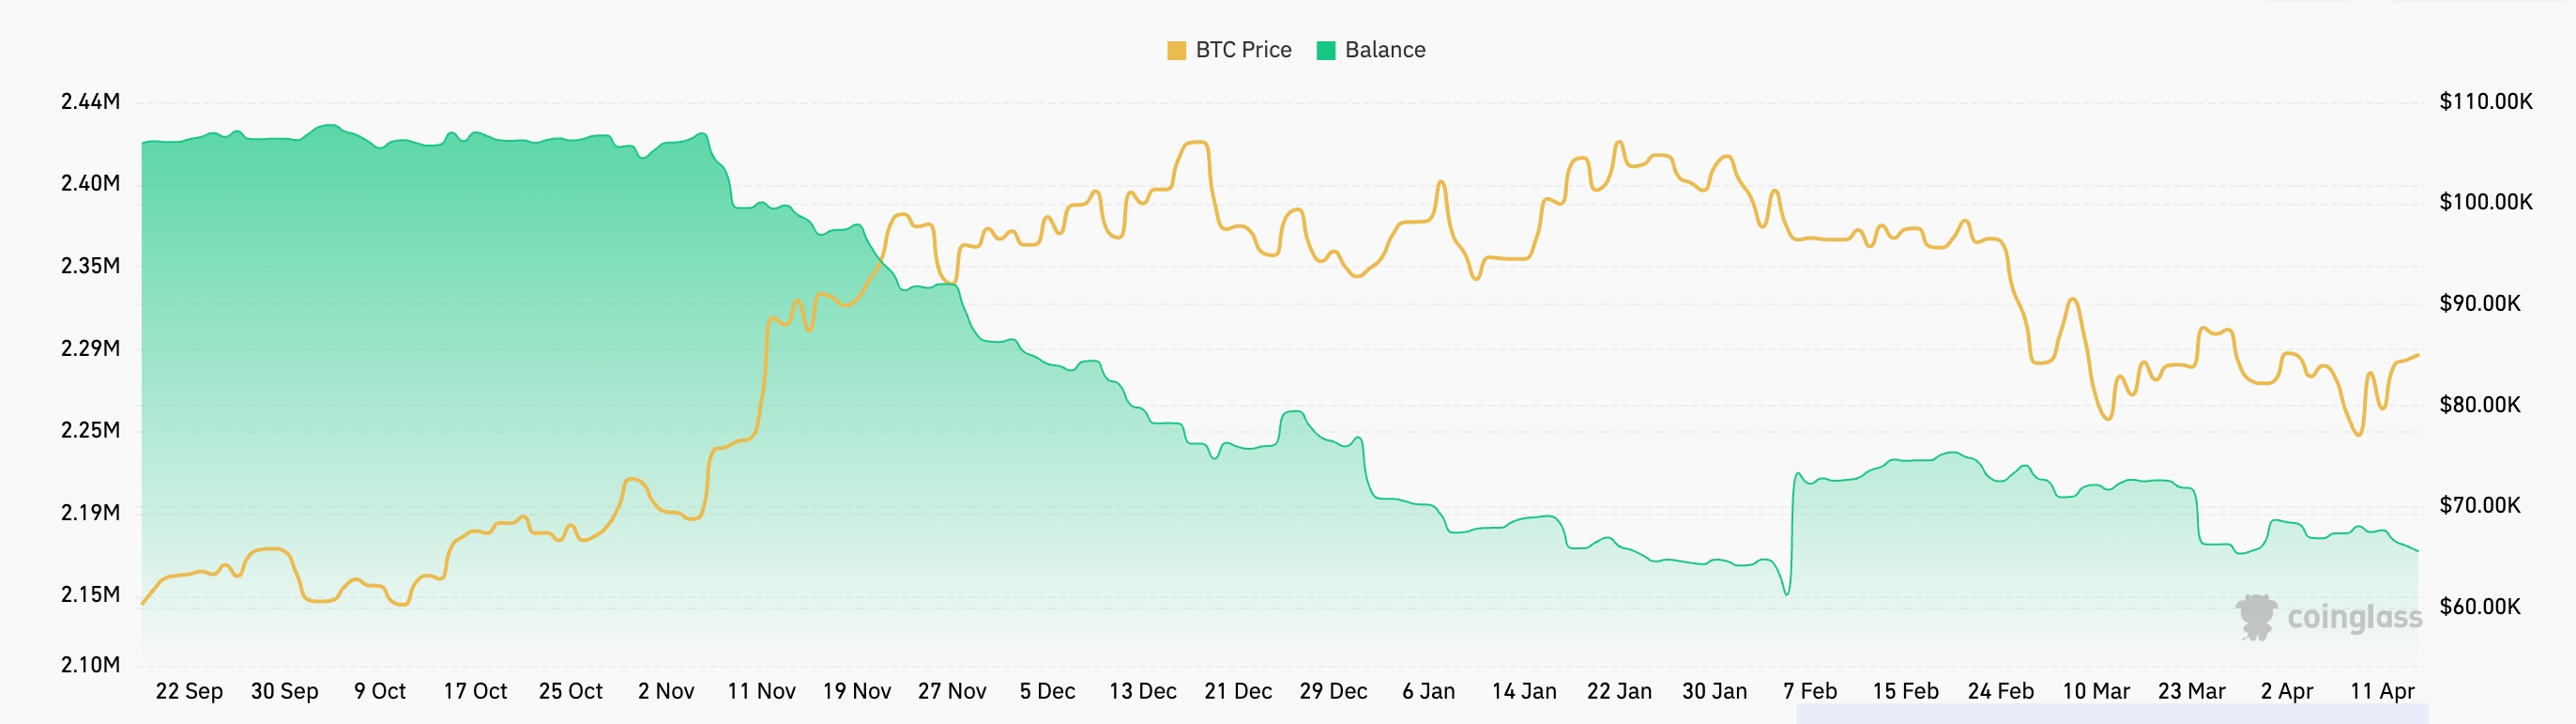
Meanwhile, fewer Bitcoins are hanging out on exchanges—down from 2.44 million last September to 2.18 million now. Hordes of holders must be thinking, “I’m not selling this monster just yet,” or they’re just confused. Either way, it’s a hint that panic isn’t the current vibe.
And if you need another crystal ball, check out gold’s recent surge, up 25% this year, hitting all-time highs. According to one crypto wizard (Joe Consorti), Bitcoin tailgates gold with a lag of about 100 to 150 days. So gold gets all the hype at the party, and Bitcoin strolls in fashionably late.
Bitcoin follows gold with a ~100 to 150-day lag.
When the printer roars to life, gold sniffs it out first, then bitcoin follows harder.
cc. @DAAF17 @LawrenceLepard
— Joe Consorti ⚡️ (@JoeConsorti) April 14, 2025
Bitcoin Price Technical Analysis (AKA Reading the Crystal Chart)
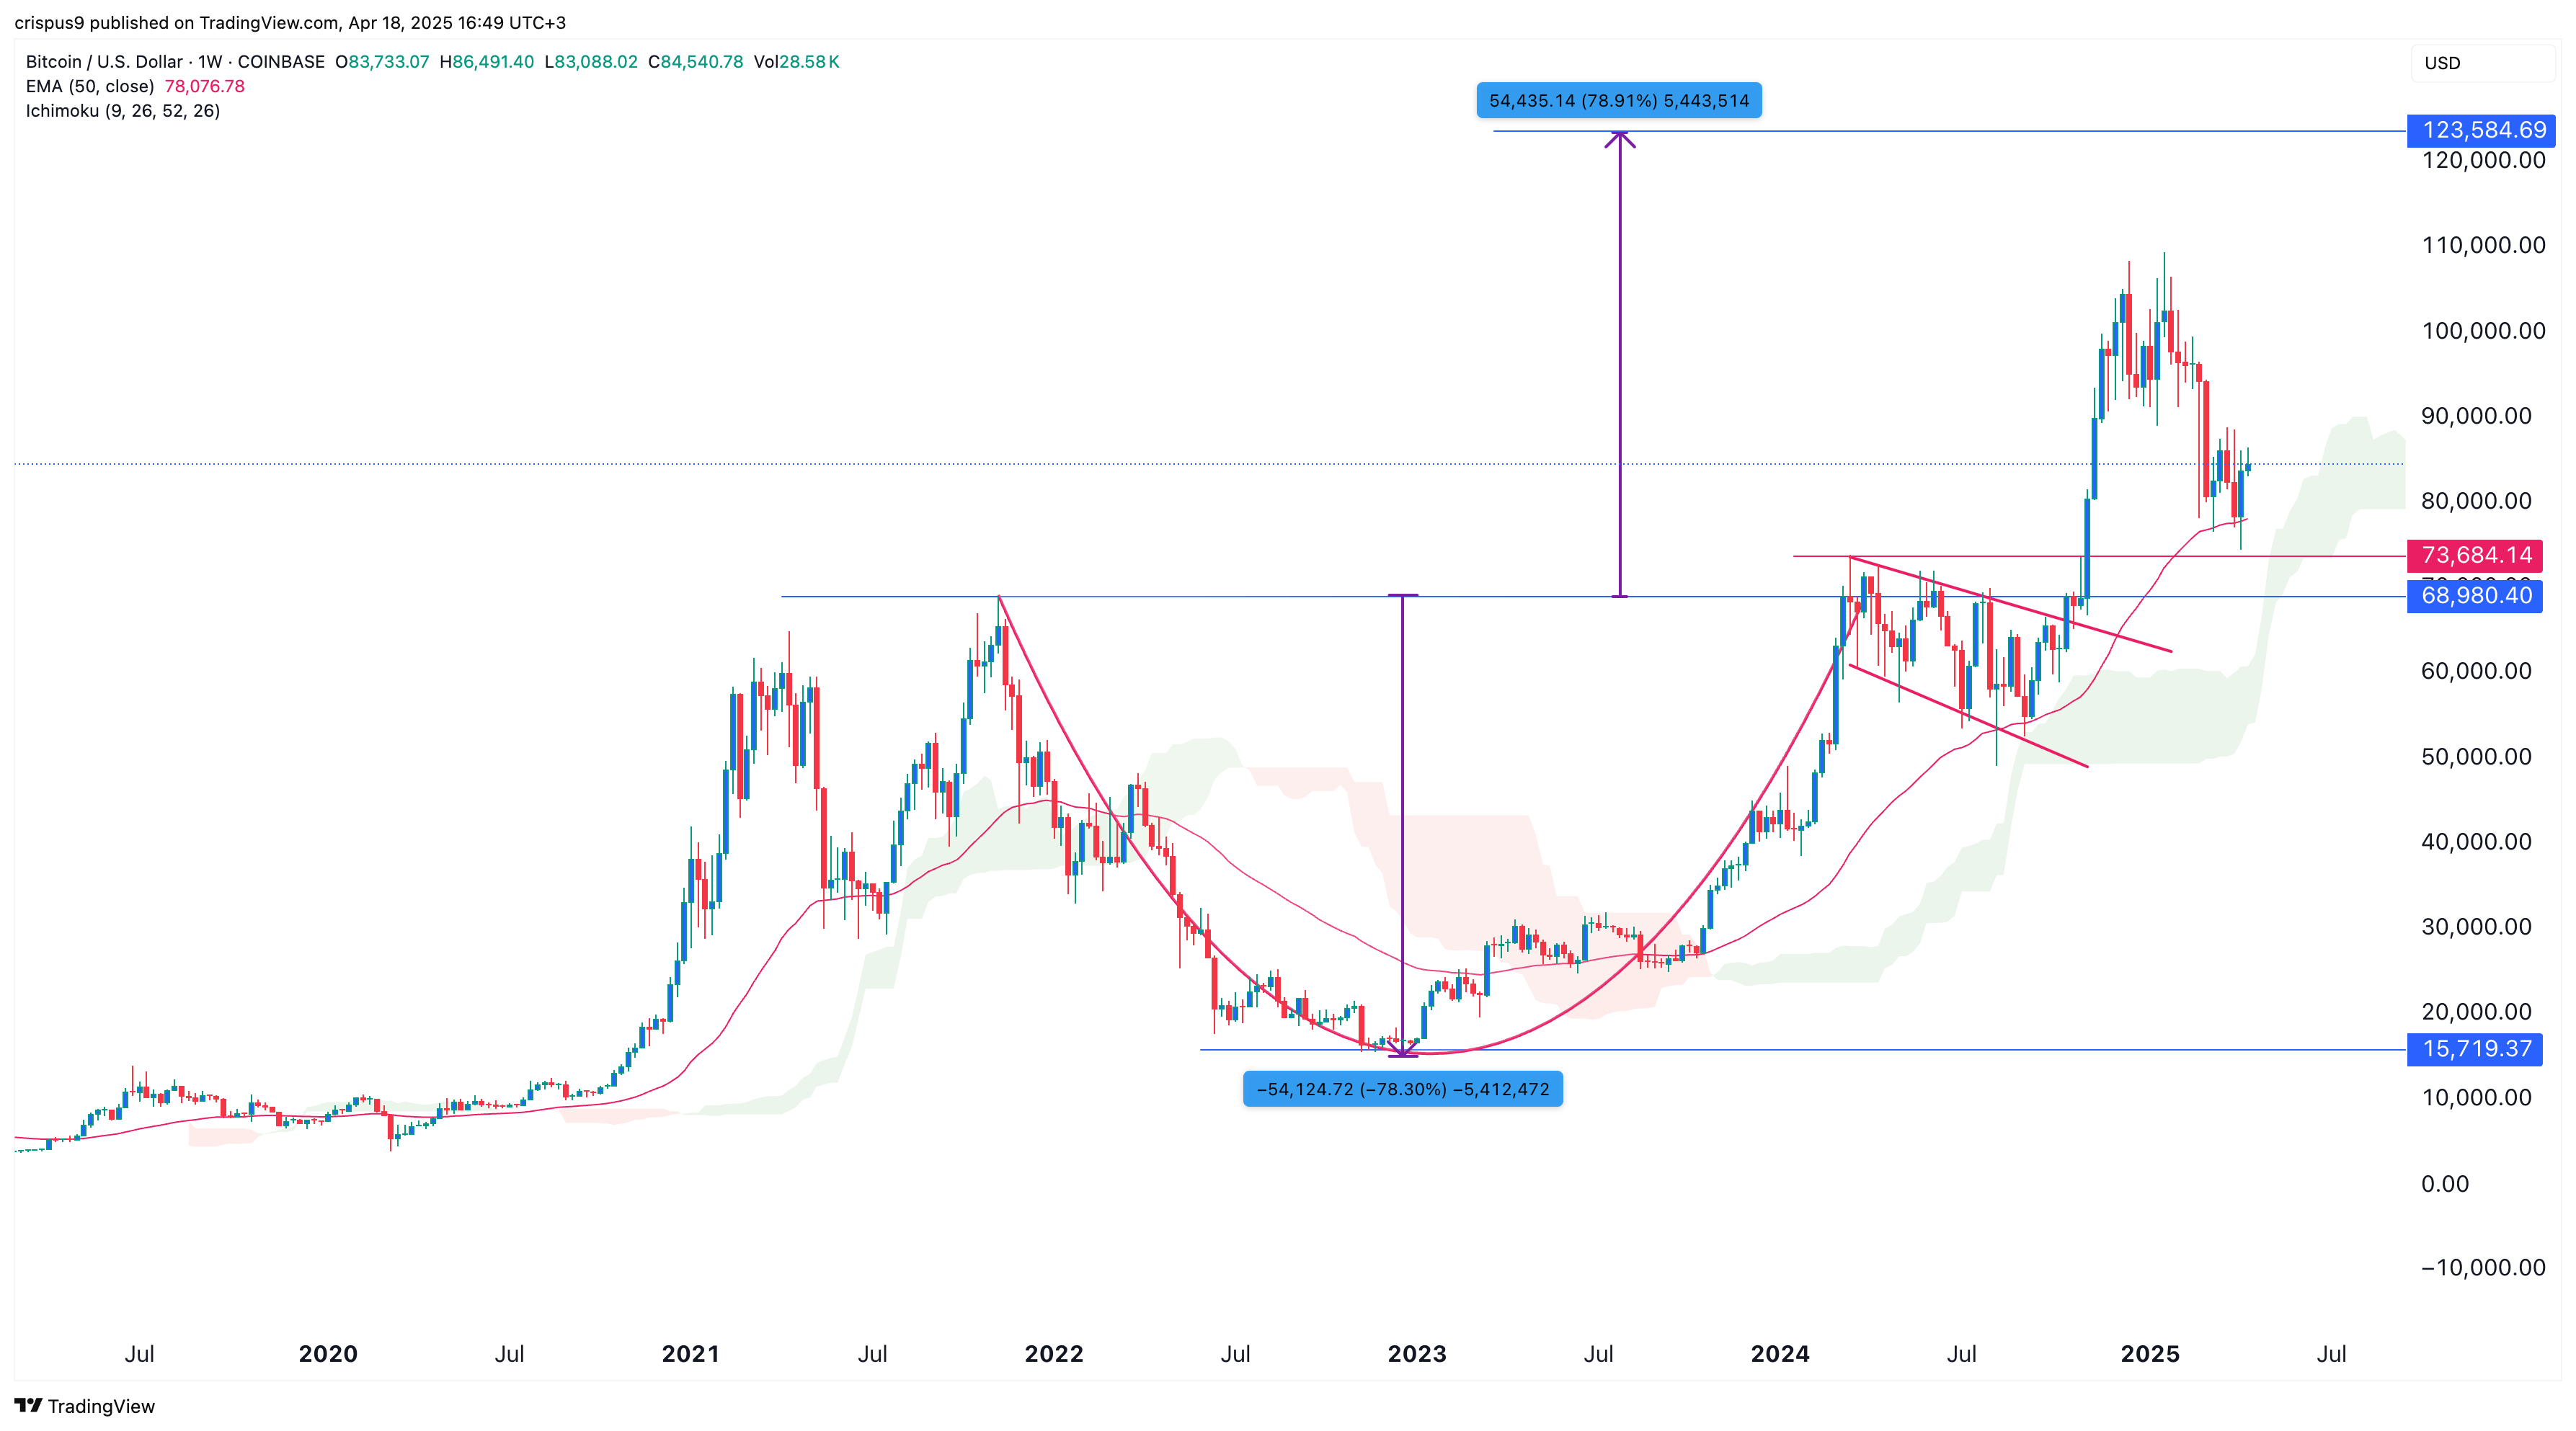
The weekly chart is basically Bitcoin saying, “I’m not down for the count just yet.” It’s hanging on to the 50-week Exponential Moving Average like a kid refusing to leave the playground since October 2023.
It’s also perched above the Ichimoku Cloud (sounds like a fancy meditation retreat but is actually bullish). Plus, it cleared a key hurdle at $73,685—the upper edge of that cup-and-handle pattern that chart geeks drool over.
This cup is pretty deep—78%—so if Bitcoin climbs the same distance it plunged, we could be looking at $123,585. That’s nearly a 45% jump and a perfect excuse for anyone to say, “I told you so” at your next family gathering.
But beware: if Bitcoin slips below $73,685, the party might be over, and the bullish outlook gets kicked to the curb.
Read More
- Silver Rate Forecast
- Polymarket’s 3.14% Pie: A Slice of Genius or Just Crumbs?
- Coinbase’s OCC Nod: Not a Bank, Just A Trust-Big Moves Ahead!
- Brent Oil Forecast
- Claude’s ID Fiasco: Anthropic’s Latest Farce in AI Theatre
- ONDO PREDICTION. ONDO cryptocurrency
- Gold Rate Forecast
- XRP’s Institutional Comeuppance: Finally, a Seat at the Table
- Crypto’s Last Gasp: Lummis Pleads, ‘Act Now or Regret Eternally’
- Bitcoin’s Wild Ride: War, Oil, and Triangles, Oh My!
2025-04-18 17:08