So, here’s the deal: Yesterday, MANTRA (OM) plummeted a truly staggering 90%, and, in case you didn’t get the memo, it’s still falling like your last attempt at baking a soufflé. The charts? Well, let’s just say they look like a post-apocalyptic scene, and if you’ve seen the Terra LUNA collapse, you might just want to look away now. Or maybe not. Your call.
OM’s RSI is basically hanging out at extreme oversold levels, which is another way of saying “Hey, no one’s buying this stuff.” When LUNA nosedived, traders were at least scrambling to snatch up some cheap tokens for a quick bounce. But, spoiler alert: Even that might be a pipe dream for MANTRA, based on how things are looking right now.
OM RSI Drops Below 10—Where’s the Party?
After crashing more than 90% in mere hours, some hopeful souls are probably thinking, “Maybe this is the moment to buy the dip!” But, the Relative Strength Index (RSI) isn’t feeling it. OM’s RSI dropped like a stone from 45 to a near-comatose 4 during the crash, and guess what? It’s barely managed to crawl back to 10.85.
The RSI is essentially a mood ring for crypto prices, telling you whether the market is too hot or too cold. When it dips below 30, it’s the financial equivalent of “Houston, we have a problem.” And above 70? Well, that’s the sign of an overzealous market.
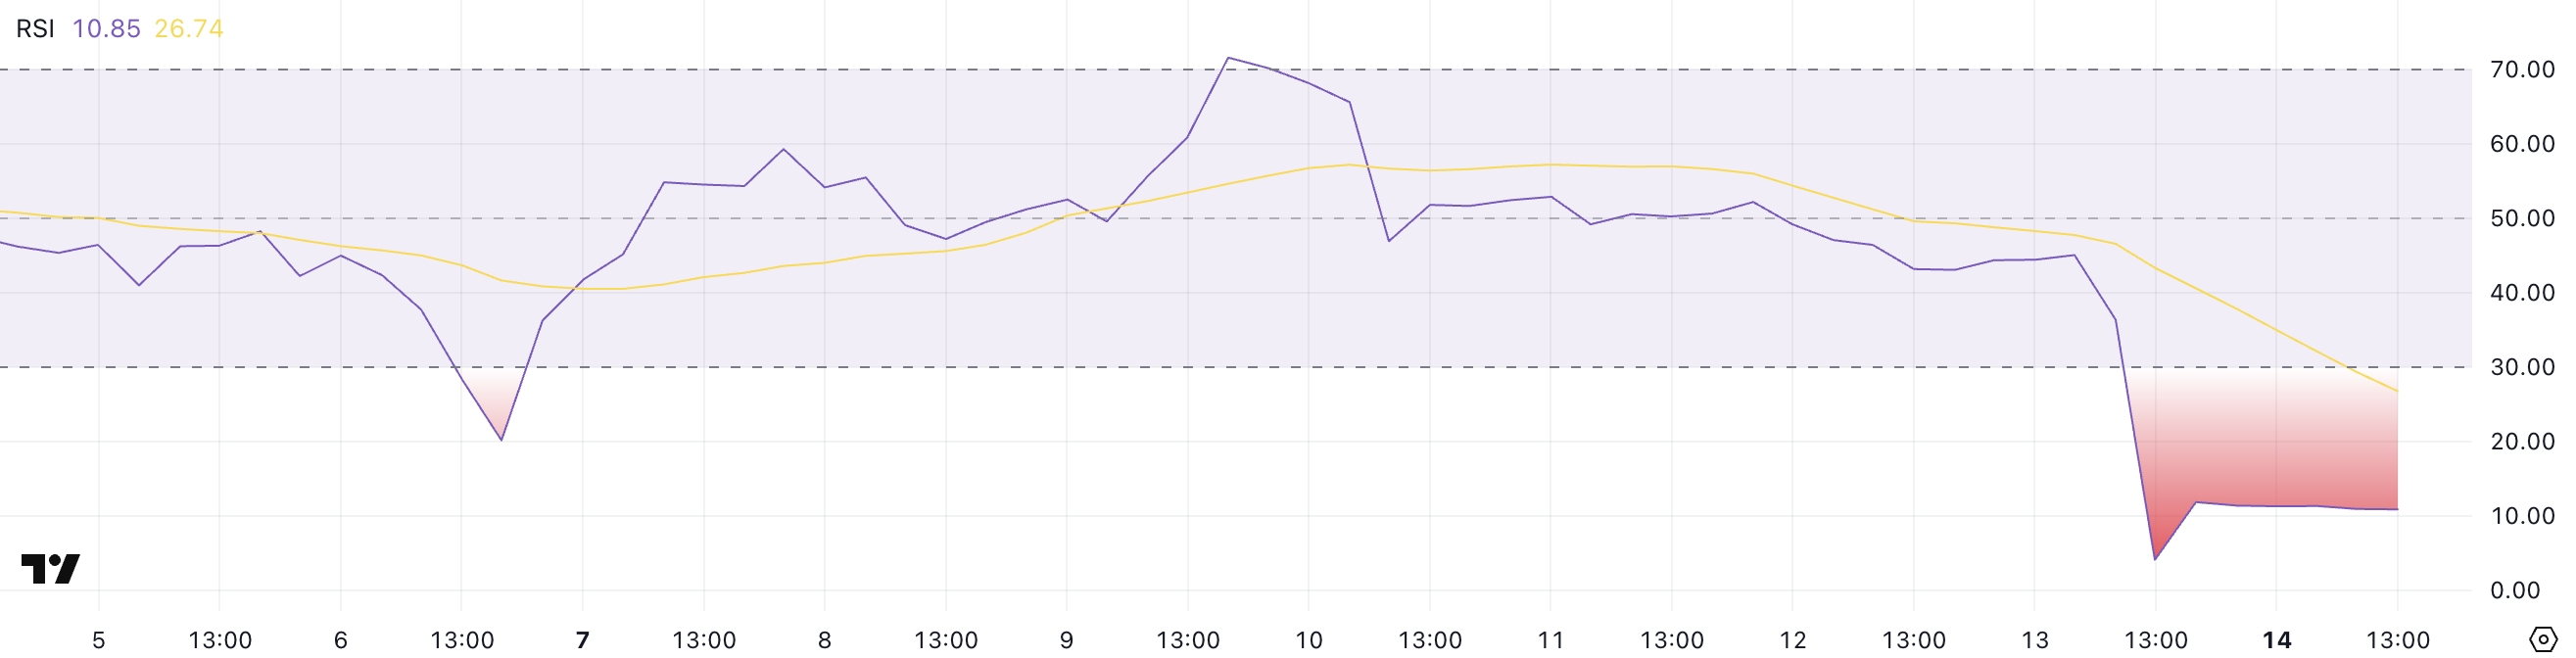
Despite the little bounce from the depths of despair, OM’s RSI is still stuck at a pitiful 10.85, which basically means no one’s rushing in to buy.
And let’s be real—this lack of buying is the perfect recipe for more doom and gloom. The sentiment? Terribly bearish. Traders are taking one look and saying, “Yeah, I think I’ll wait until the apocalypse is over before I buy in.”
Recently, analysts were chatting with BeInCrypto and casually mentioned that MANTRA might not even have a real, solid value on the blockchain. Shocking, I know.
OM might be gearing up for further losses or, at best, a long period of stagnation where we all stare at our screens waiting for some miracle to appear. Spoiler alert: Don’t hold your breath.
The DMI Is Telling Us ‘Nope, Not Today’
Let’s talk about the DMI (Directional Movement Index), which is basically a “how strong is this trend?” indicator, and right now, it’s telling us that the bearish momentum is so strong it could bench-press a small car. The ADX, a measure of trend strength, is sitting pretty at 47.23—way above the 25 mark, which means this trend is far from slowing down.
The -DI (selling pressure) peaked at 85.29, but now it’s at 69.69 (yes, really, the crypto market loves these weirdly specific numbers), which suggests that while the mass panic might be easing, it’s still running the show.
On the flip side, the +DI (buying pressure) has absolutely tanked, from 3.12 to 2.42, making it pretty clear that bullish buying is basically on vacation.

This disparity in the numbers shows that even though the sell-off might have slowed down a bit, no one’s really jumping in to scoop up the discounts.
And with +DI sitting near rock bottom, it’s safe to say traders are just not interested in picking up OM. Even after its 90% price slash, they’re still like, “I’ll pass.”
As long as this sad, sad scenario persists—strong trend strength, high selling pressure, and virtually no buying action—it’s safe to assume that OM is likely to stay firmly in bearish territory, with any hope of a recovery hinging on a complete turnaround in sentiment. Which, honestly, doesn’t seem very likely. Cheers to that.
Read More
- Pi Hotel Vietnam: First to Accept Pi Coin Payments in Real-World Transactions
- TAO PREDICTION. TAO cryptocurrency
- USD TRY PREDICTION
- Silver Rate Forecast
- Brent Oil Forecast
- EUR CNY PREDICTION
- IP/USD
- EUR CLP PREDICTION
- PI PREDICTION. PI cryptocurrency
- DOGE PREDICTION. DOGE cryptocurrency
2025-04-15 03:48