So, Dogecoin decided to have a little party above $0.1080, did it? Against the US Dollar, no less. Now it’s sitting there, sipping its punch, trying to decide if it’s ready to break above $0.1165 or if it’s just going to spill the bowl and blame the cat.
- DOGE, feeling frisky, hopped over $0.1120 and $0.1150 like they were tiny hurdles at a dog agility competition.
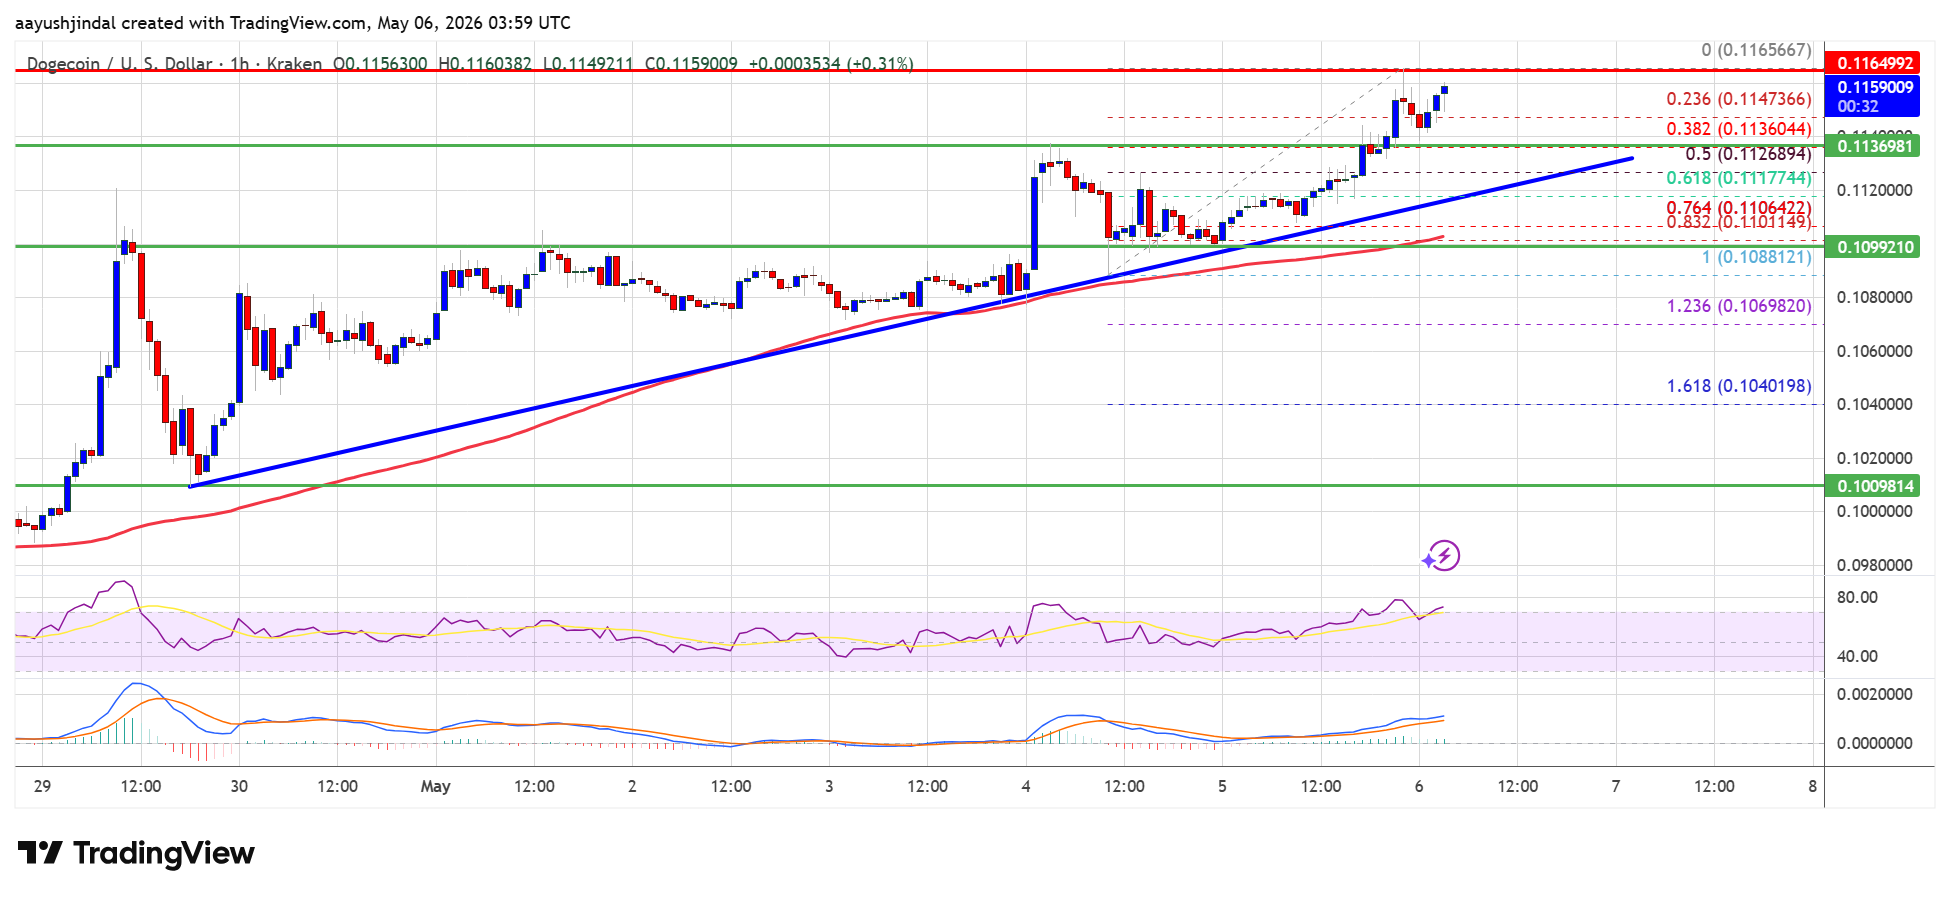
- It’s now lounging above the $0.1120 mark, with the 100-hourly simple moving average as its favorite chew toy.
- Apparently, there’s a bullish trend line forming at $0.1125 on the hourly chart. Because nothing says “financial stability” like a trend line drawn by someone who probably also believes in horoscopes.
- If it stays above $0.1120, it might just keep going. Or it might get distracted by a squirrel. Hard to say.
After settling above $0.1050-like a houseguest who finally remembers to take off their shoes-Dogecoin decided to join the cool kids, Bitcoin and Ethereum, in their upward climb. It breezed past $0.1080 like it was late for a very important date.
The bulls, ever the optimists, pushed it past $0.1150. It peaked at $0.1165, then paused to catch its breath, consolidating above the 23.6% Fib retracement level. Because, you know, Fibonacci levels are the astrology of the financial world.
Now, DOGE is chilling above $0.1120, with the 100-hourly simple moving average as its security blanket. That bullish trend line at $0.1125? Still there, still trying to look important.
If it decides to make another move, the first stop is $0.1165. After that, the bulls are eyeing $0.120. Because why stop at one arbitrary number when you can aim for another?
Next up: $0.1220. If it closes above that, $0.1250 is the new target. And if it keeps going, $0.1320 is on the menu. The bulls’ ultimate dream? $0.1350. Because nothing says “financial success” like a number with three decimal places.
Or Maybe It’ll Just Nap Instead
But let’s not get ahead of ourselves. If DOGE can’t get past $0.1165, it might just take a nap. First stop on the way down: $0.1135. After that, $0.1125 or the trend line. It’s basically the financial equivalent of “I’ll just lie down for a minute.”
The real danger zone? $0.110. If it breaks below that, it’s heading straight for $0.1050 or even $0.1020. Because why not end the day with a dramatic flop?
Technical Indicators
Hourly MACD – The MACD is gaining momentum in the bullish zone. Or, as I like to call it, “the zone where people pretend they know what they’re talking about.”
Hourly RSI – The RSI is above 50. Which means… something. Probably.
Major Support Levels – $0.1135 and $0.1125. Because every good drama needs a safety net.
Major Resistance Levels – $0.1165 and $0.1200. Because every good drama also needs a wall to run into.
Read More
- ETC PREDICTION. ETC cryptocurrency
- Gold Rate Forecast
- Brent Oil Forecast
- EUR CNY PREDICTION
- ONDO PREDICTION. ONDO cryptocurrency
- XRP EUR PREDICTION. XRP cryptocurrency
- GBP CHF PREDICTION
- IP/USD
- You Won’t Believe What XRP Just Did: $75M ETF Inflows and Whale Drama Unveiled!
- USD VND PREDICTION
2026-05-06 08:11