The winds of fortune have shifted for Ethereum (ETH), as its price tumbles from the lofty heights of its daily ascending channel. Weeks of coiled tension, like a farmer’s spring waiting to snap, have given way, and now the fields of crypto are whispering of a slide to $2,070-if the meager support at $2,264 crumbles like a dry biscuit.
At the time of this scribbling, the second-largest cryptocurrency lingers near $2,291, a modest decline of 0.93% in the past day. Meanwhile, ETH/BTC has fallen harder than a drunk at a barn dance, collapsing from its own channel and now eyeing 0.028 BTC after a retest as clean as a whistle.
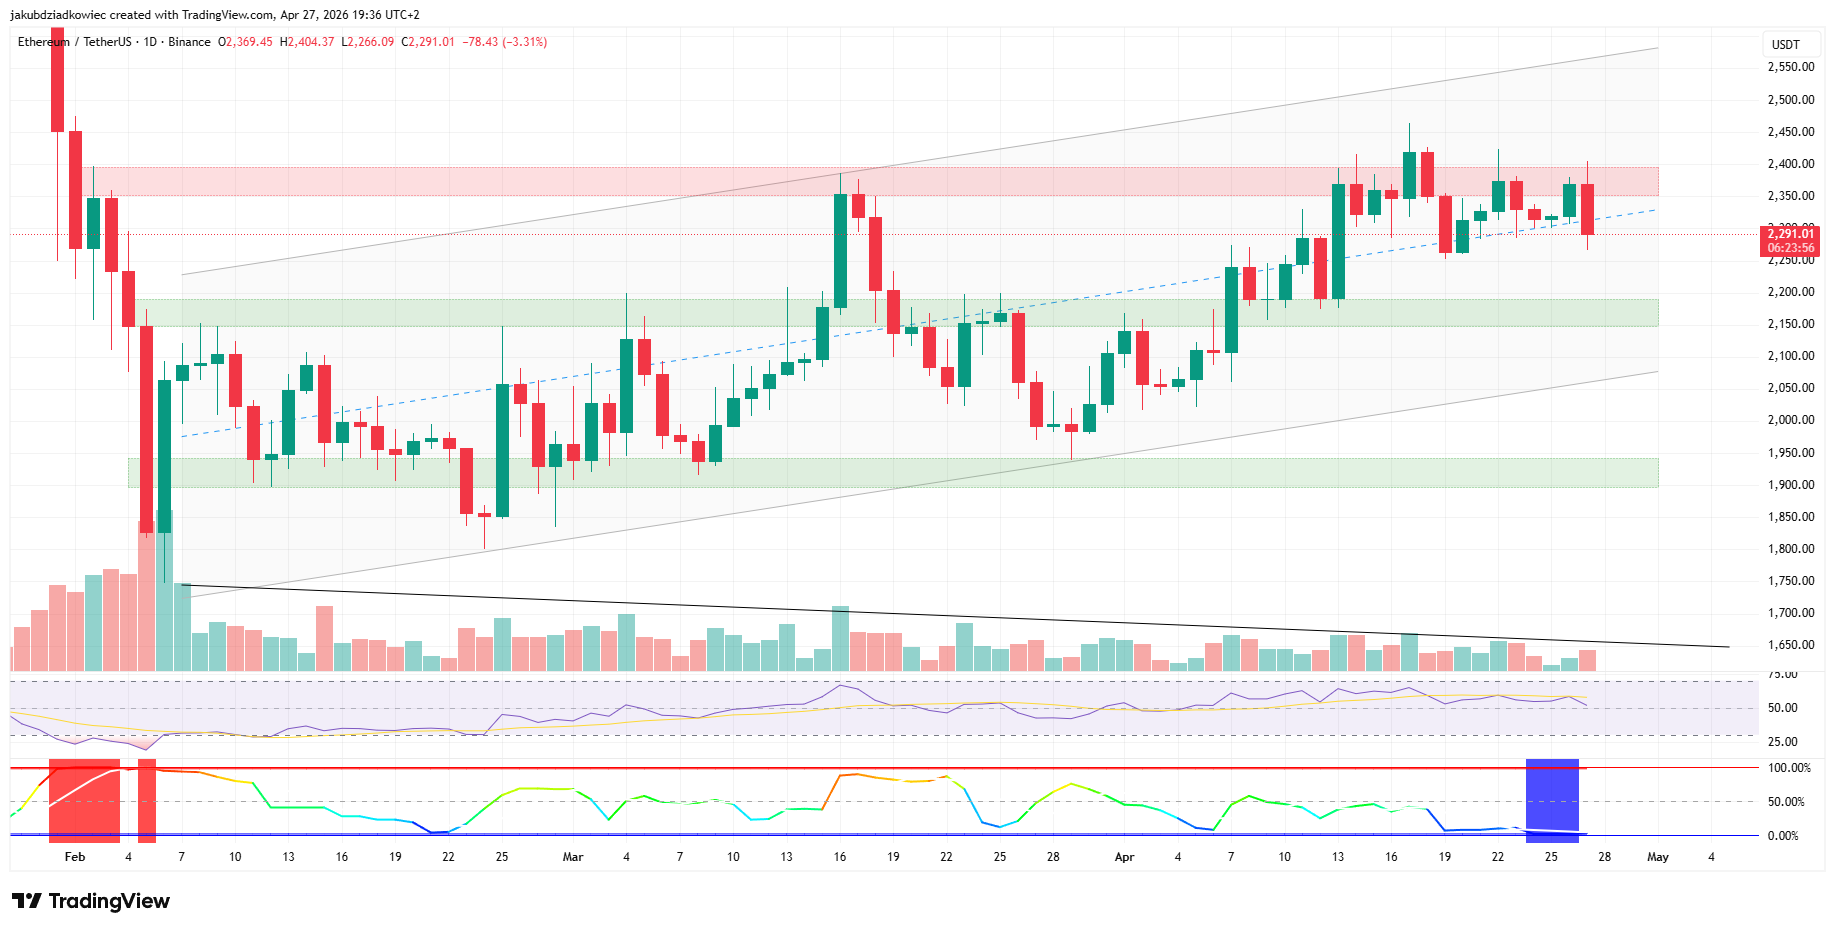
Daily ETH/USDT Chart: A Storm Brewing in Compressed Volatility
The daily ETH/USDT chart paints a picture of an ascending parallel channel, born on February 6, where the price has danced like a fiddler at a hoedown, touching the upper and lower bands with precision. The midline, once a sturdy fence, has flipped between support and resistance more times than a politician’s promises. Now, that fence is breaking, and if the close confirms it, the channel points to a slide toward $2,070. Below that, the supports stack like hay bales at $2,001.70 and $1,920, tested in the chill of February and March.
To the upside, $2,370 has batted away the price like a fly, remaining the resistance that would invalidate this bearish tale. Previous forecasts for April had marked this band as the pivot, the turning point in our little drama.
The RSI sits just above 50, as neutral as a fence-sitter at a town hall meeting. More telling is the volatility reading (BBWP), showing three consecutive blue bars so low they’d make a turtle blush, while daily volume dwindles like a creek in August. This setup, history tells us, resolves with a move so big it’ll make your grandma’s pie look small.
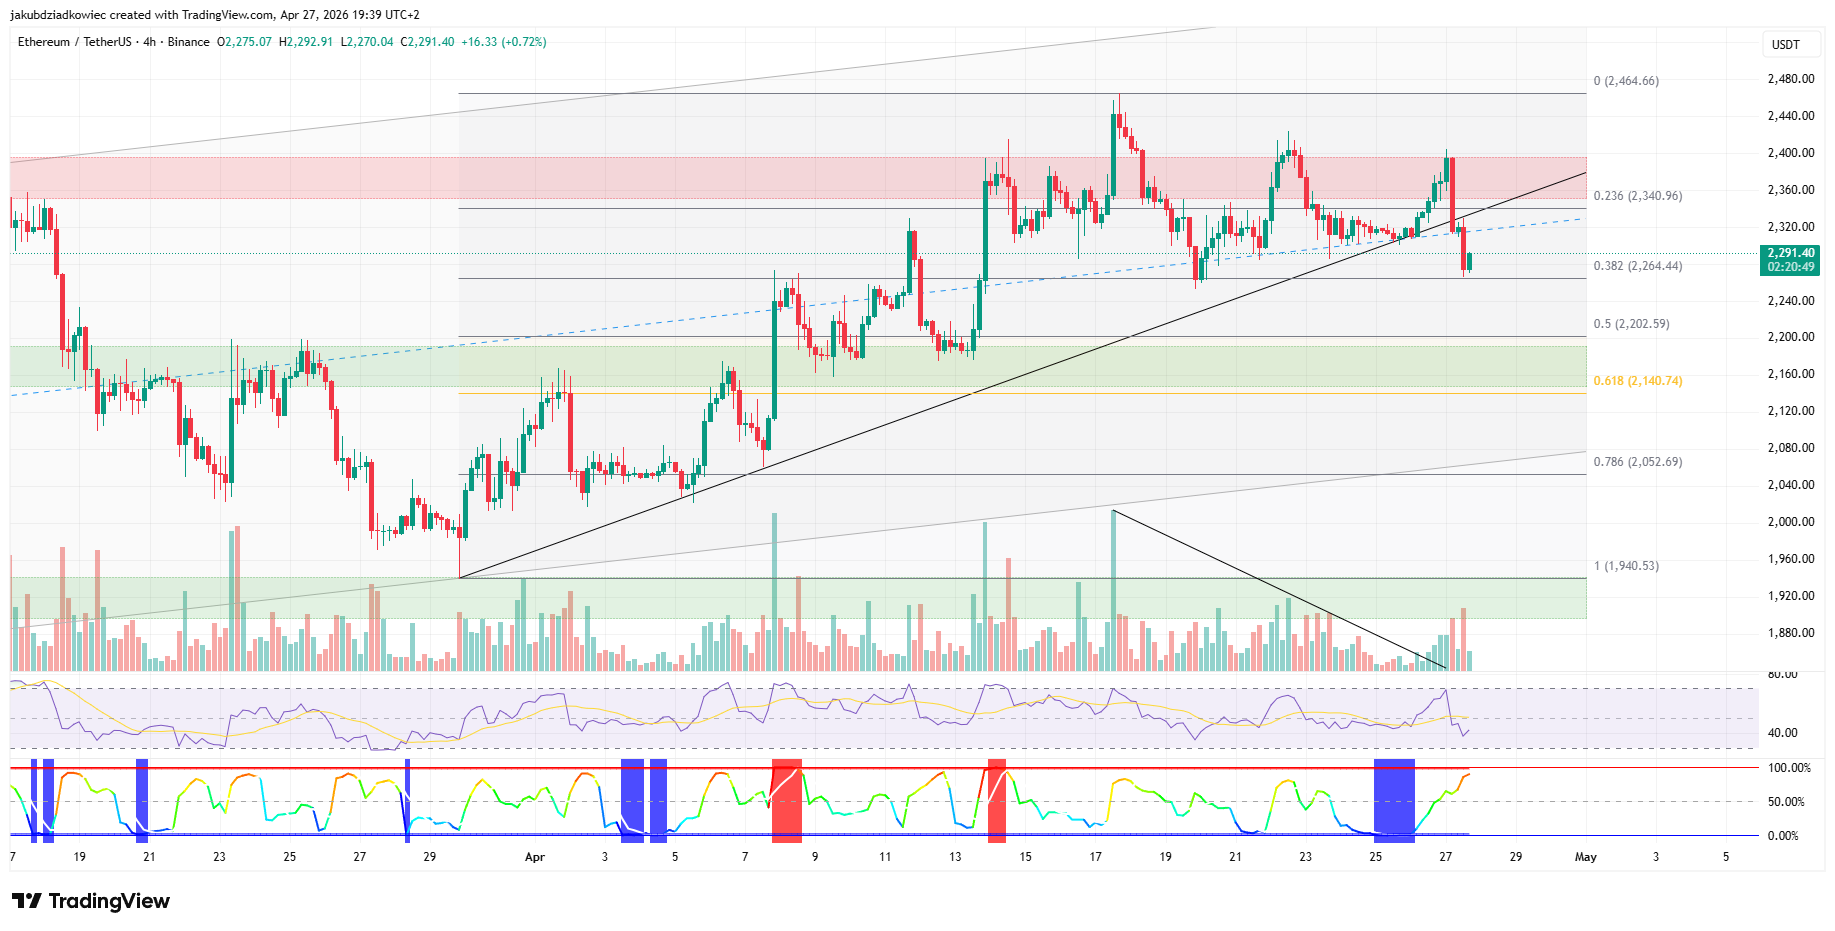
4-Hour Ethereum Chart: The Bear Has Awoken
While the daily picture still hides in its multi-month structure like a hermit in a cave, the 4-hour ETH/USDT chart shows the damage plain as day. The price has broken its short-term trendline and is now testing the 0.382 Fibonacci retracement at $2,264. If that fails, the next support sits in the golden pocket just above $2,114, a place where even bears might pause to catch their breath.
The BBWP volatility indicator is screaming red, a stark contrast to the daily compression, confirming that fast money is already in the thick of it. The RSI on the 4-hour timeframe has rolled over into bearish territory, and short-term volume spiked on the trendline break. It’s as clear as a bell: the sellers are calling the tune.
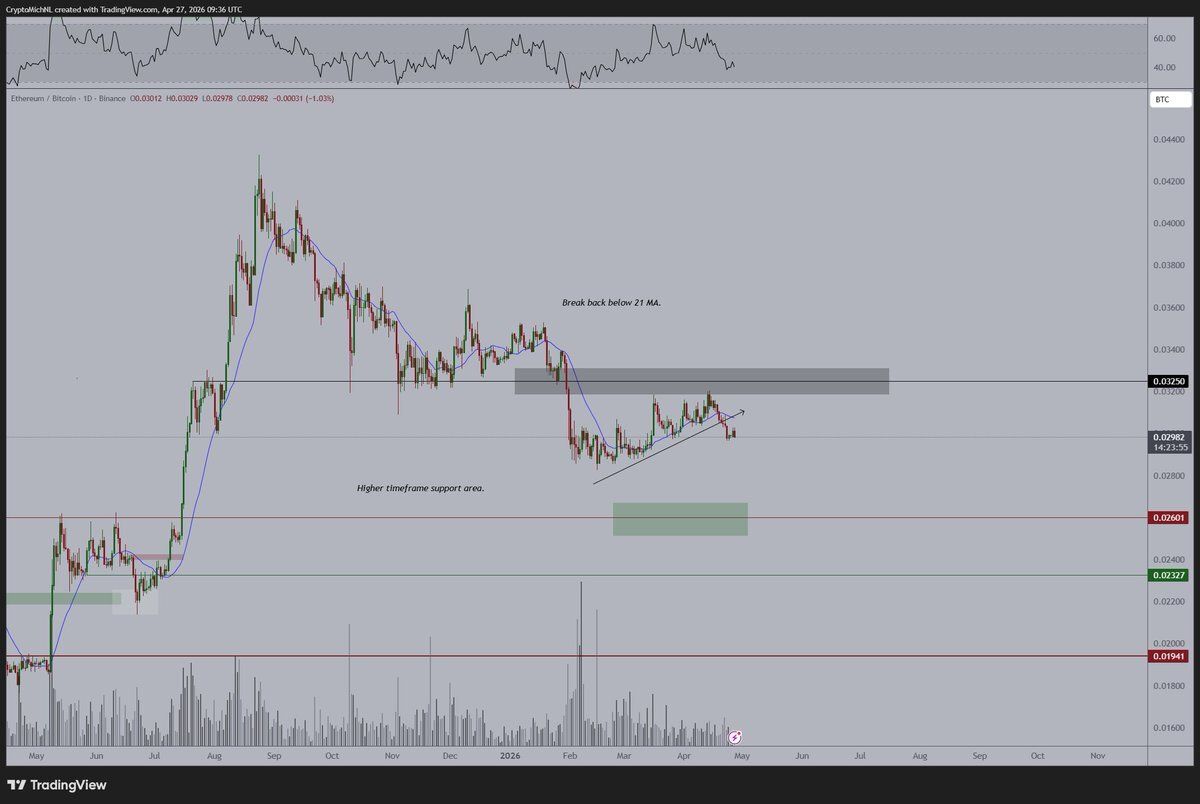
Michael van de Poppe: The Crypto Soothsayer
The relative weakness against Bitcoin only adds fuel to the bearish fire. Analyst Michael van de Poppe, a man who reads charts like a farmer reads the sky, has highlighted 0.032 BTC as the level that would reopen the upside, and 0.026 BTC as the higher-timeframe support that matters for long-term positions.
“I keep repeating the crucial levels for $ETH. Unfortunately, it broke down, which means there’s no continuation of the uptrend-yet. As long as it stays below 0.032 $BTC, I’m not interested until I see a clear bottoming formation or when it tests 0.026. The latter is a higher timeframe support area, which I find important to monitor for long-term positions,” says Michael van de Poppe
He also noted that the prior cycle bottom for ETH was marked in April 2025, framing 0.026 BTC as the area where institutional and long-term accumulation becomes as interesting as a barn dance on a Saturday night.
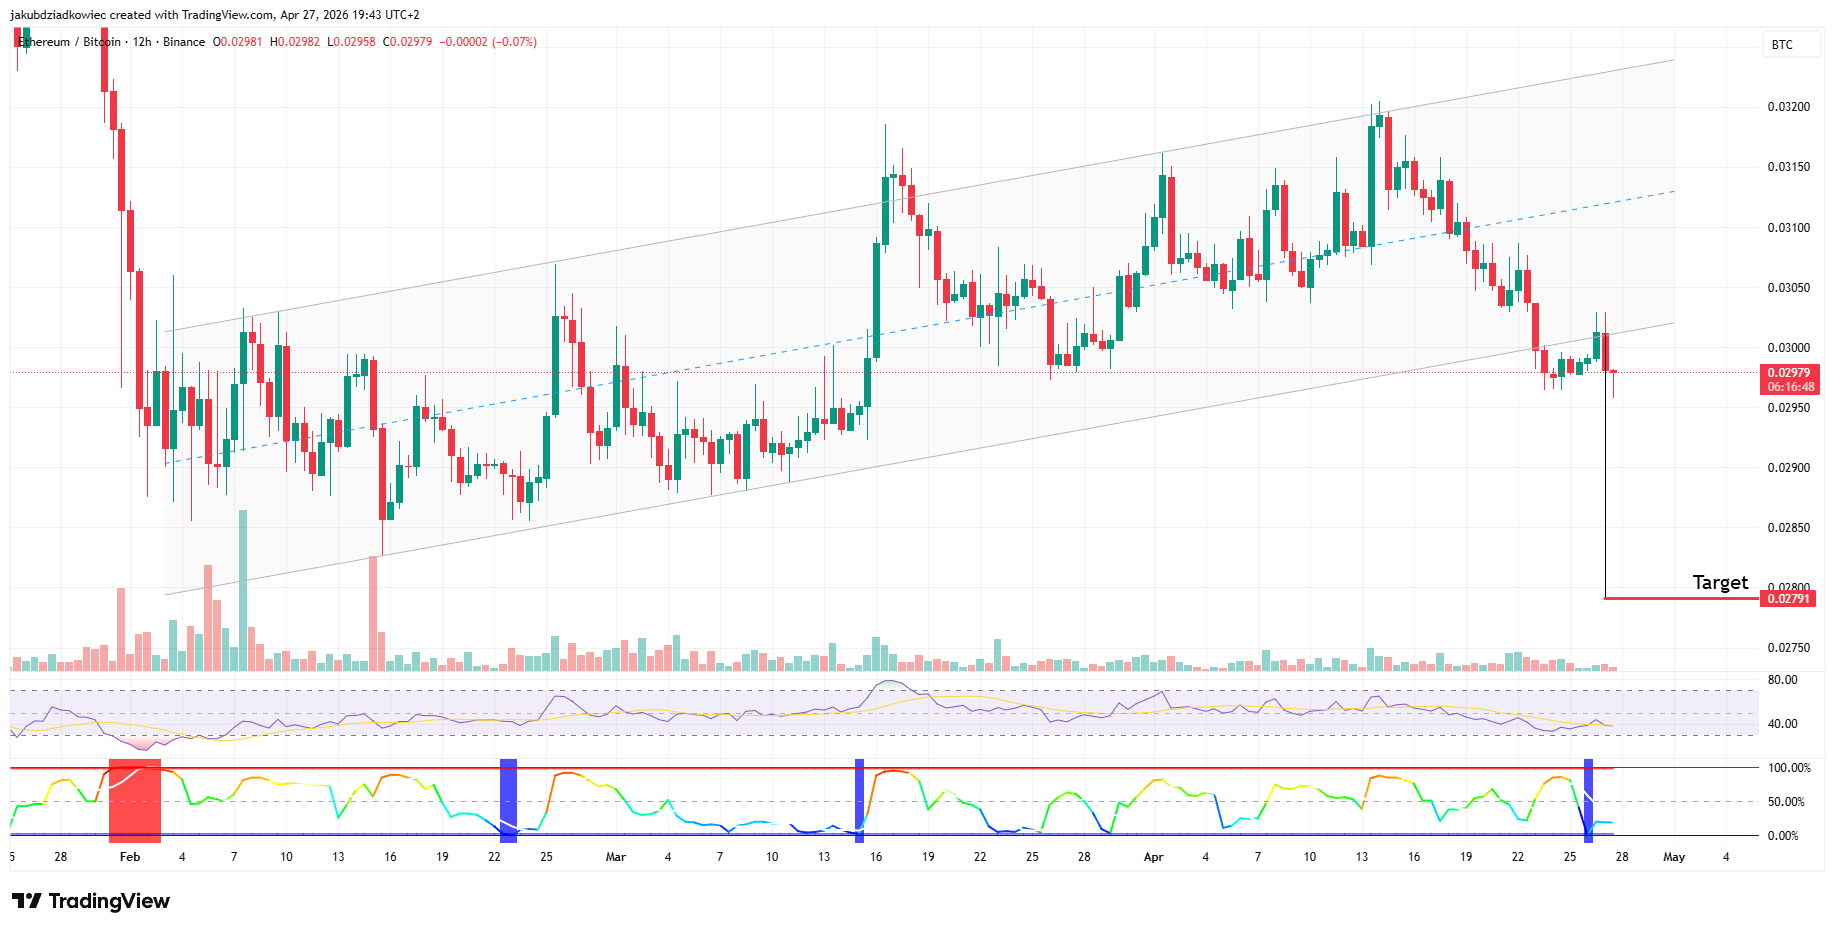
ETH/BTC 12-Hour Chart: The Slide Continues
The 12-hour ETH/BTC chart tells the same tale of woe. A well-established ascending parallel channel guided price action through February, March, and most of April, but the lower band gave way on April 23. Today, the pair is collapsing after a retest as textbook as a schoolmarm’s lesson. Projecting the channel height to the breakdown point yields a target of 0.028 BTC, aligning with the broader bearish scenario outlined by Van de Poppe.
The Relative Strength Index (RSI) is bearish, and volatility has compressed sharply right after the break. This combination, history tells us, precedes continuation rather than reversal, suggesting the pair is coiling for the next leg lower, like a snake ready to strike.
The next 48 to 72 hours will likely determine whether Ethereum defends its daily channel or unwinds toward the spring lows. Traders eyeing higher-timeframe targets will need that defense to hold, or they’ll be left holding the bag like a farmer with a broken fence.
Read More
- Silver Rate Forecast
- Brent Oil Forecast
- Gold Rate Forecast
- USD TRY PREDICTION
- ETH PREDICTION. ETH cryptocurrency
- USD MXN PREDICTION
- EUR PLN PREDICTION
- DOGE AUD PREDICTION. DOGE cryptocurrency
- Bitcoin’s Descent: Will It Hit $95K by September? 🚀💸
- USD ISK PREDICTION
2026-04-28 00:36