Ah, Solana. The cryptocurrency that’s currently sitting in the financial equivalent of a dentist’s waiting room-calm on the surface, but with a faint hum of anxiety in the air. Institutions are quietly hoovering up SOL like it’s the last slice of pizza at a party, indicators are whispering sweet nothings about a potential shift, and yet the price just… sits there. Hovering around $80 like a teenager deciding whether to commit to a haircut. It’s one of those moments where nothing is happening, and yet everything feels imminent.
Institutions Are Gobbling Up SOL Like It’s Going Out of Style
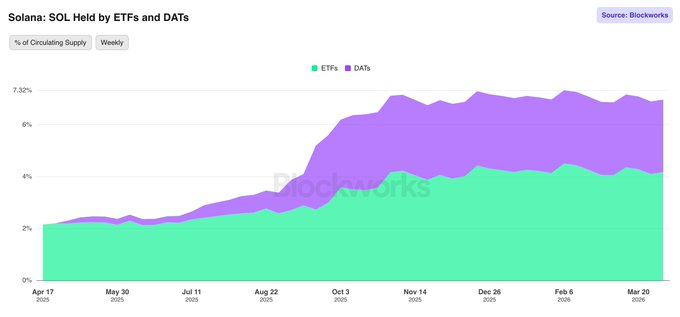
Remember when ETFs held a measly 2.15% of SOL and DATs were just a twinkle in someone’s eye? Well, fast forward to today, and ETFs now control 4.17% while DATs have muscled their way to 2.79%. Together, that’s nearly 7% of the circulating supply. That’s not your aunt buying SOL with her bingo winnings-that’s big money stepping in with the subtlety of a brick through a window. And all this while the price is still dithering like a tourist with a map upside down. Fascinating, isn’t it?
Solana’s Price: A Drama in Two Acts (or $80 vs $60)
Now, let’s pivot to the weekly chart, where the plot thickens like a bowl of overcooked oatmeal. SOL is consolidating around $80, a level that once served as a sturdy base back in January 2024. If history decides to repeat itself-which it rarely does, but let’s indulge-this could be the springboard for a leap toward $200. But hold your horses (and your SOL). There’s also a descending channel lurking in the background, gently nudging the price downward like a passive-aggressive neighbor. The lower boundary was tested at $67.50 in February 2026, and if that holds, a dip toward $60 isn’t off the table. It’s a financial fork in the road: $80 or bust, or $60 and a collective sigh.
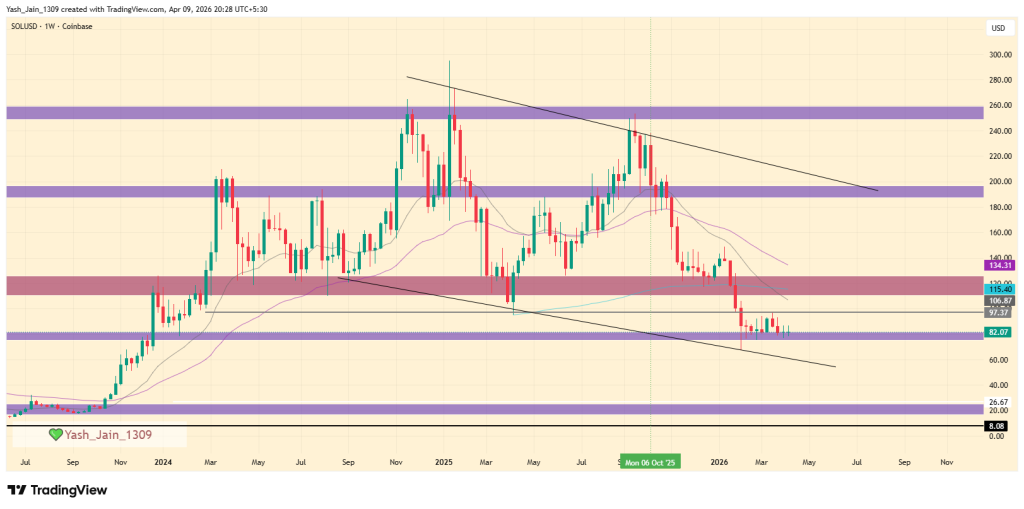
So, will it be a rocket launch or a slow deflation? Place your bets, folks.
Indicators: The Financial Equivalent of Mixed Signals
Here’s where it gets as confusing as a IKEA instruction manual. MACD is teetering on the edge of a bullish crossover, like a tightrope walker after three cups of coffee. The AO histogram is already waving pom-poms for weekly bullish momentum, and even CMF, at -0.20, is starting to curve upward, hinting that money might be trickling back in. And RSI? Sitting at 32.55-not exactly overheated, more like the financial equivalent of a nap.
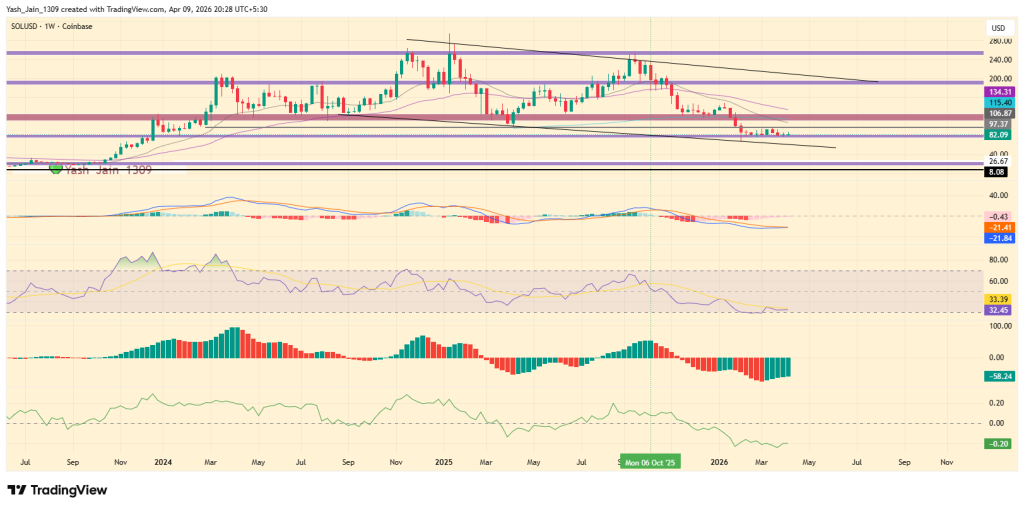
In short, the momentum indicators are whispering “recovery,” even if the price is still stuck in a holding pattern. It’s like the universe is saying, “I’m thinking about it, okay?”
$80 or $60: The Great Solana Debate
So, what’s the verdict? Well, it might not even be about Solana itself. The fundamentals are solid, institutions are piling in, and the network is chugging along like a well-oiled machine. The real wildcard? Broader sentiment. Geopolitics. Market mood swings. If the stars align and $80 holds, $200 starts to look like a plausible destination. But if fear rears its ugly head and that descending channel stays in charge, a dip to $60 could be the final gut-check before any real recovery.
Either way, this isn’t about chasing hype-it’s about watching which domino falls first. And in the meantime, we’ll all be here, popcorn in hand, waiting for Solana to make up its mind.
Read More
- Gold Rate Forecast
- EUR CNY PREDICTION
- Brent Oil Forecast
- USD MXN PREDICTION
- IP/USD
- EUR CLP PREDICTION
- Silver Rate Forecast
- EUR HUF PREDICTION
- Why These 5 Meme Coins Could Crash or Cash Your Crypto Party in May 2025 🚀🐒
- USD HKD PREDICTION
2026-04-09 18:06