As of April 9th, Solana (SOL) is trading at $82.20. Its price has decreased by 3% in the last 24 hours and is down 34% so far this year. Despite this decline, many traders are using leverage, indicating they expect the price to increase.
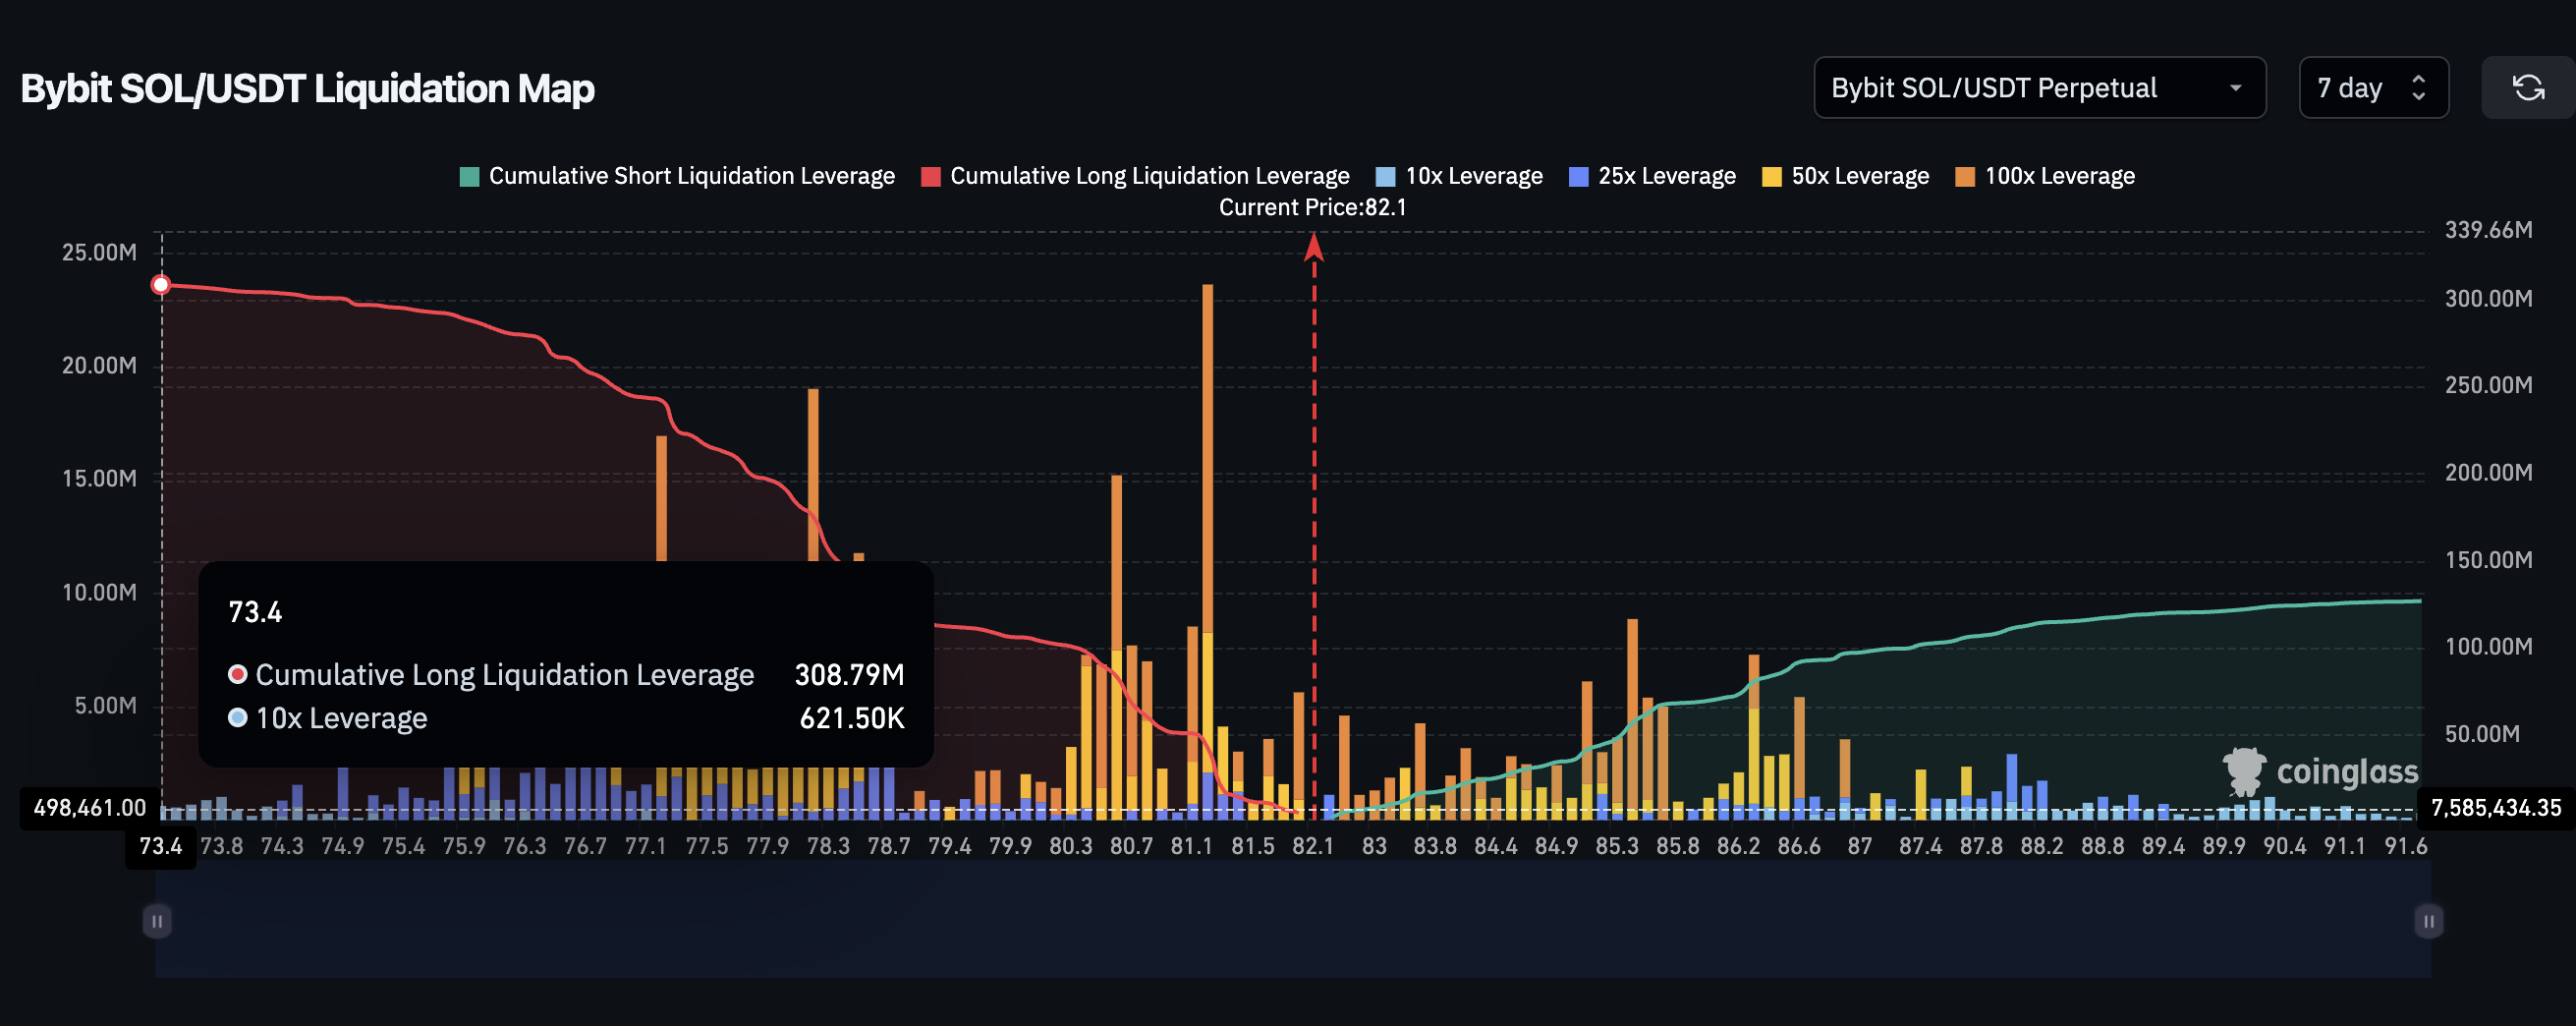
Bybit data shows significantly more traders are leveraged long on Solana ($309 million) than short ($127 million) – a 2.4 times difference, which is unusual given the recent price drops. This suggests traders aren’t giving up on Solana rising. Technical analysis indicates a potential bullish pattern forming, and on-chain data reveals a large amount of Solana being held, which may explain why many remain optimistic despite the ongoing price decline.
Price Weakness Meets a 2.4x Long Bias as a Reversal Pattern Takes Shape
Over the last month, Solana’s price has fallen by nearly 5%, coinciding with market concerns about the potential for a ceasefire and a shift of investments into stocks. So far this year, SOL’s value has decreased by 34%, making it one of the worst-performing major cryptocurrencies.
Looking at trading activity, there’s a significant difference between long and short positions. On Bybit for the SOL/USDT perpetual contract, traders have been liquidated (forced to close their positions) on long positions worth $308.79 million, compared to $127.02 million for short positions. This means there’s approximately 2.4 times more leveraged money on the long side than the short side.
Interested in getting more crypto insights? Subscribe to Editor Harsh Notariya’s daily newsletter here.
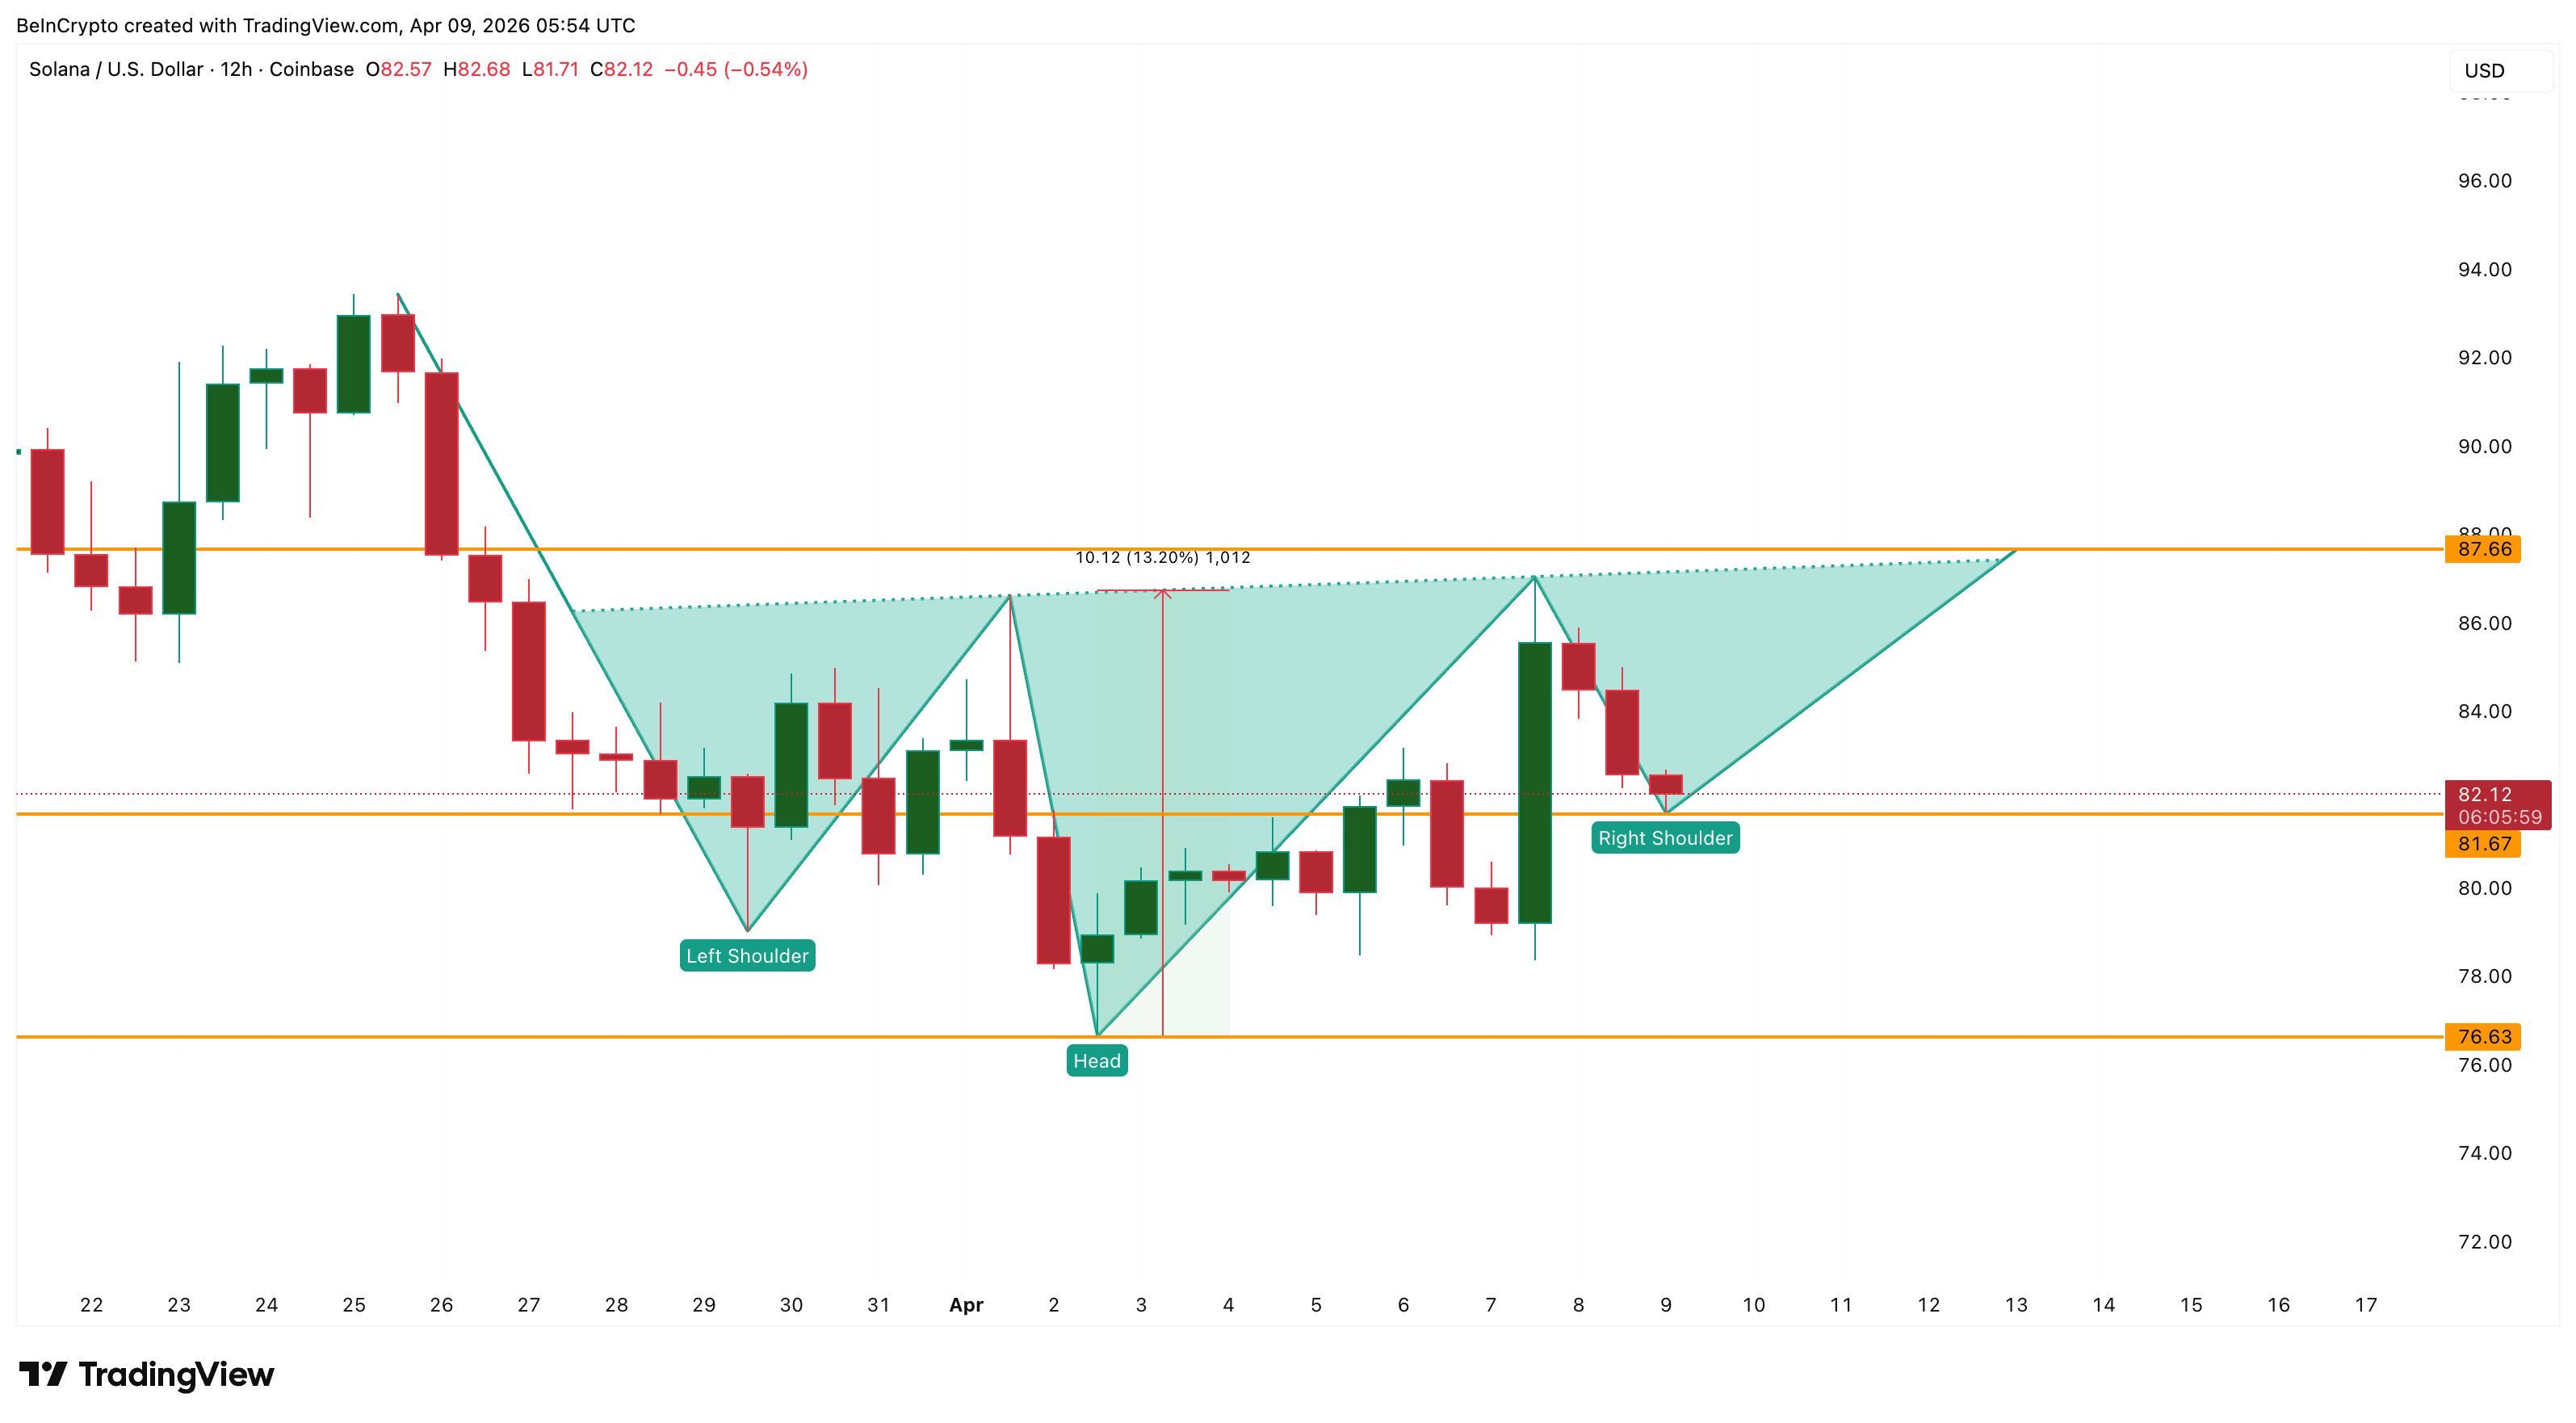
Looking at a 12-hour chart makes the recent price movement clearer. Solana (SOL) is starting to form a pattern called an inverse head and shoulders, which usually signals a price increase. The right side of this pattern is currently developing, and the price is near its lowest point for that side. If the pattern holds – meaning SOL stays above $76.63 – it suggests traders using leverage believe this recent drop is the last step before the price goes up.
Just noticing a trend isn’t enough to explain $309 million worth of risky investments. Looking at the blockchain data shows us why people are so confident in this direction.
17.5 Million SOL Accumulated at the Exact Level Where the Right Shoulder Sits
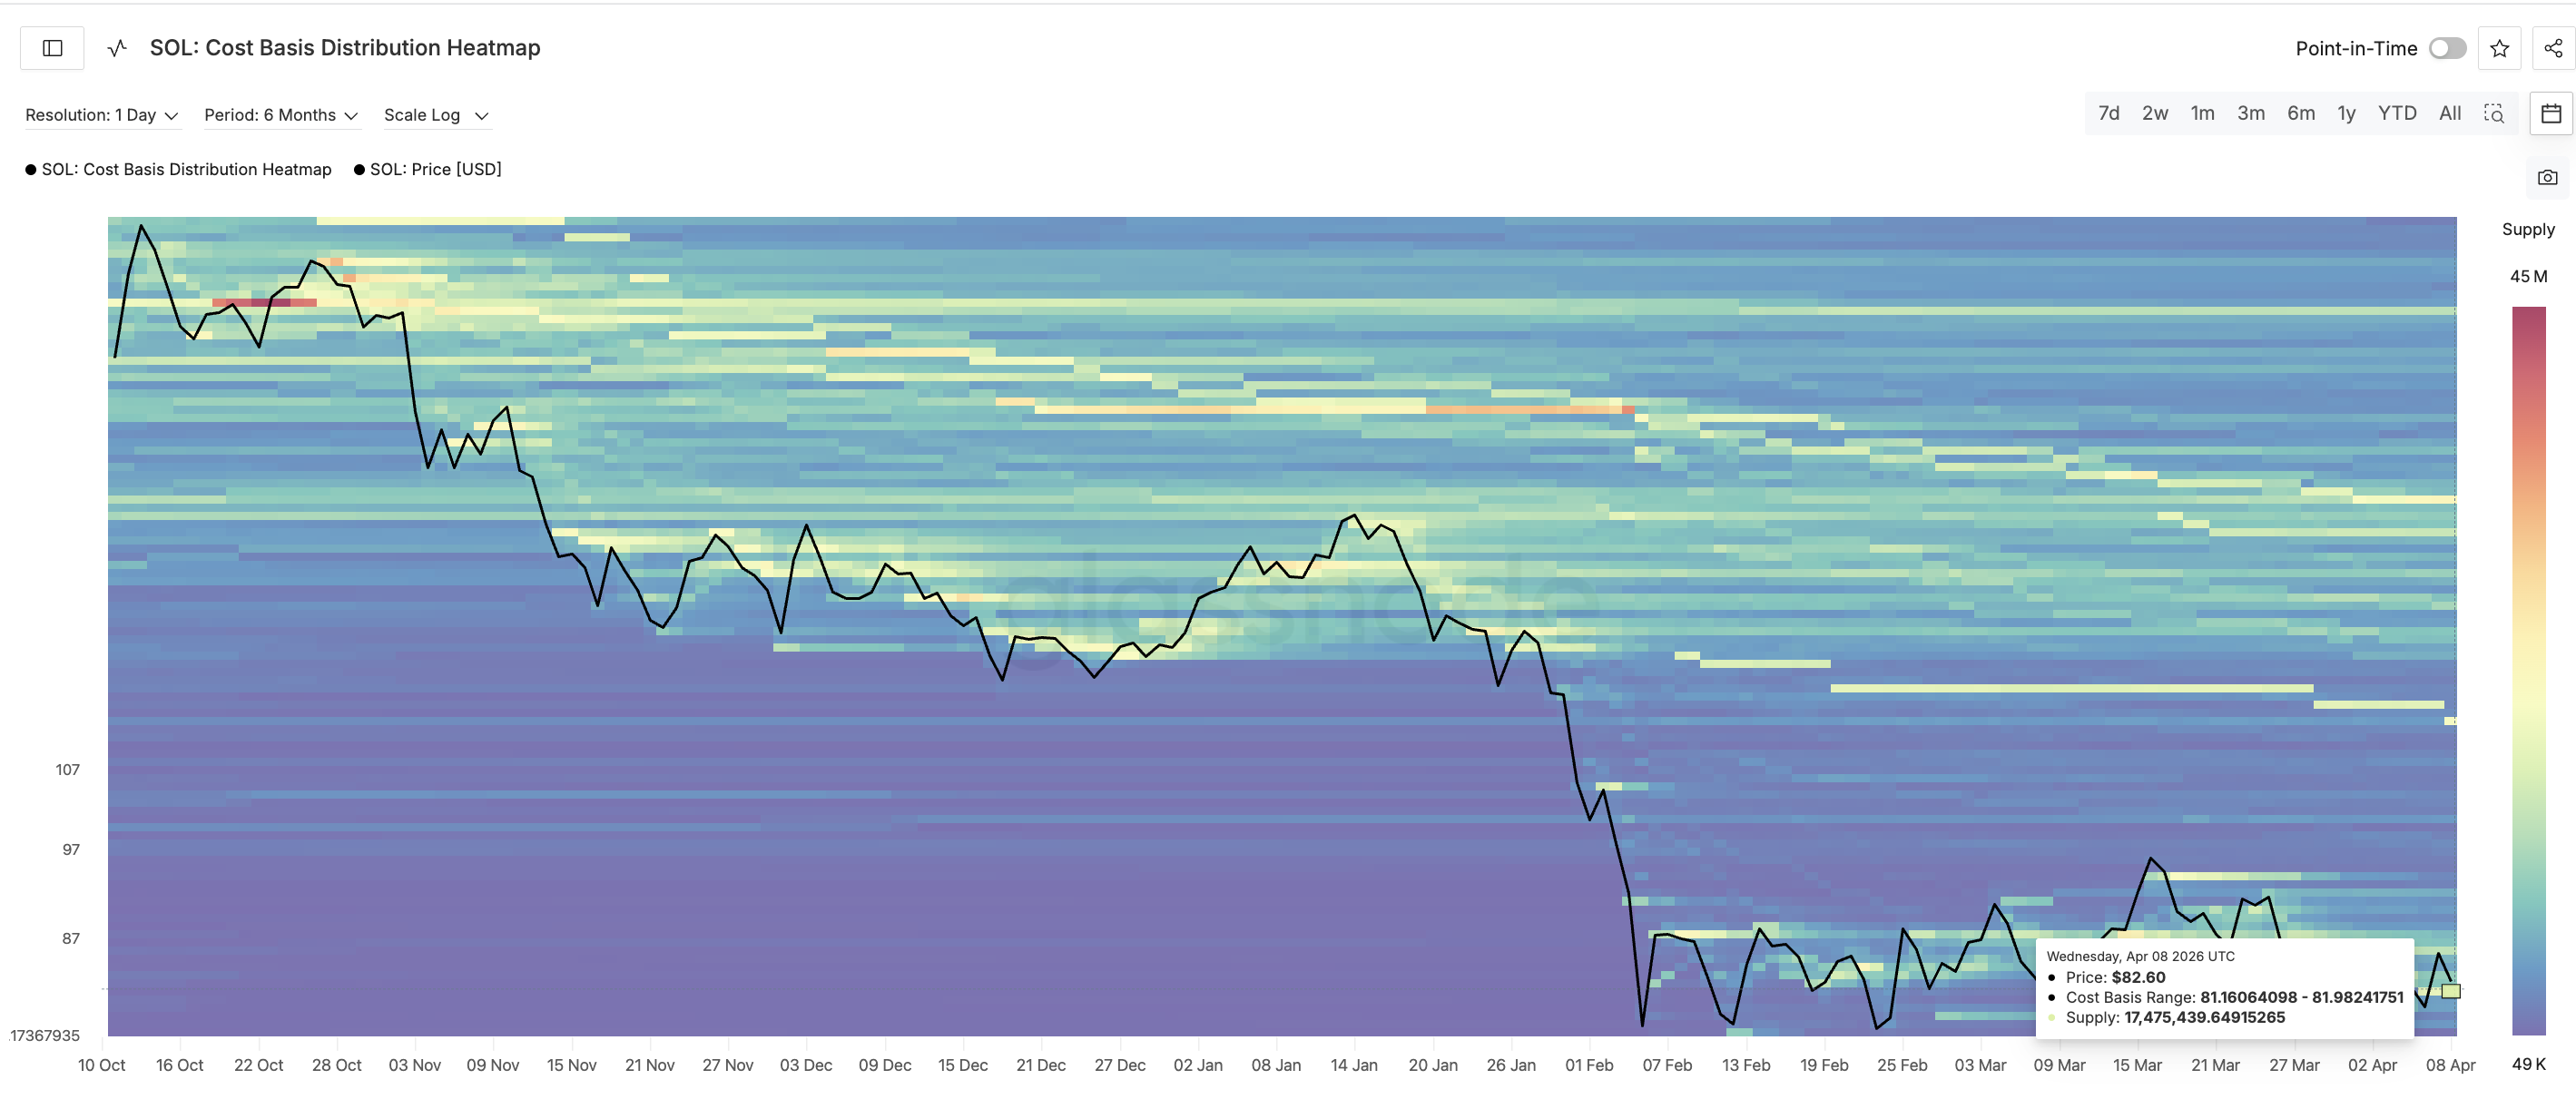
Glassnode’s cost basis distribution heatmap reveals a significant concentration of SOL holdings between $81.16 and $81.98. Roughly 17.47 million SOL was accumulated within this price range, making it the area with the most substantial holder concentration.
As I’ve been analyzing the data, I’ve noticed a key support level around $81.67 – specifically, the lowest wick on the right shoulder. This isn’t random; it seems traders who purchased between $81.16 and $81.98 are actively working to maintain that price. Every time the price dips into this range, it’s quickly bought up, likely because many holders don’t want to lock in losses on their investments.
This activity on the blockchain is what gives the inverse head and shoulders pattern its strength. The pattern is reliable because it’s backed by actual buying interest, rather than just risky borrowing. It looks like traders on Bybit are seeing the same positive signs and are making moves to profit from them.
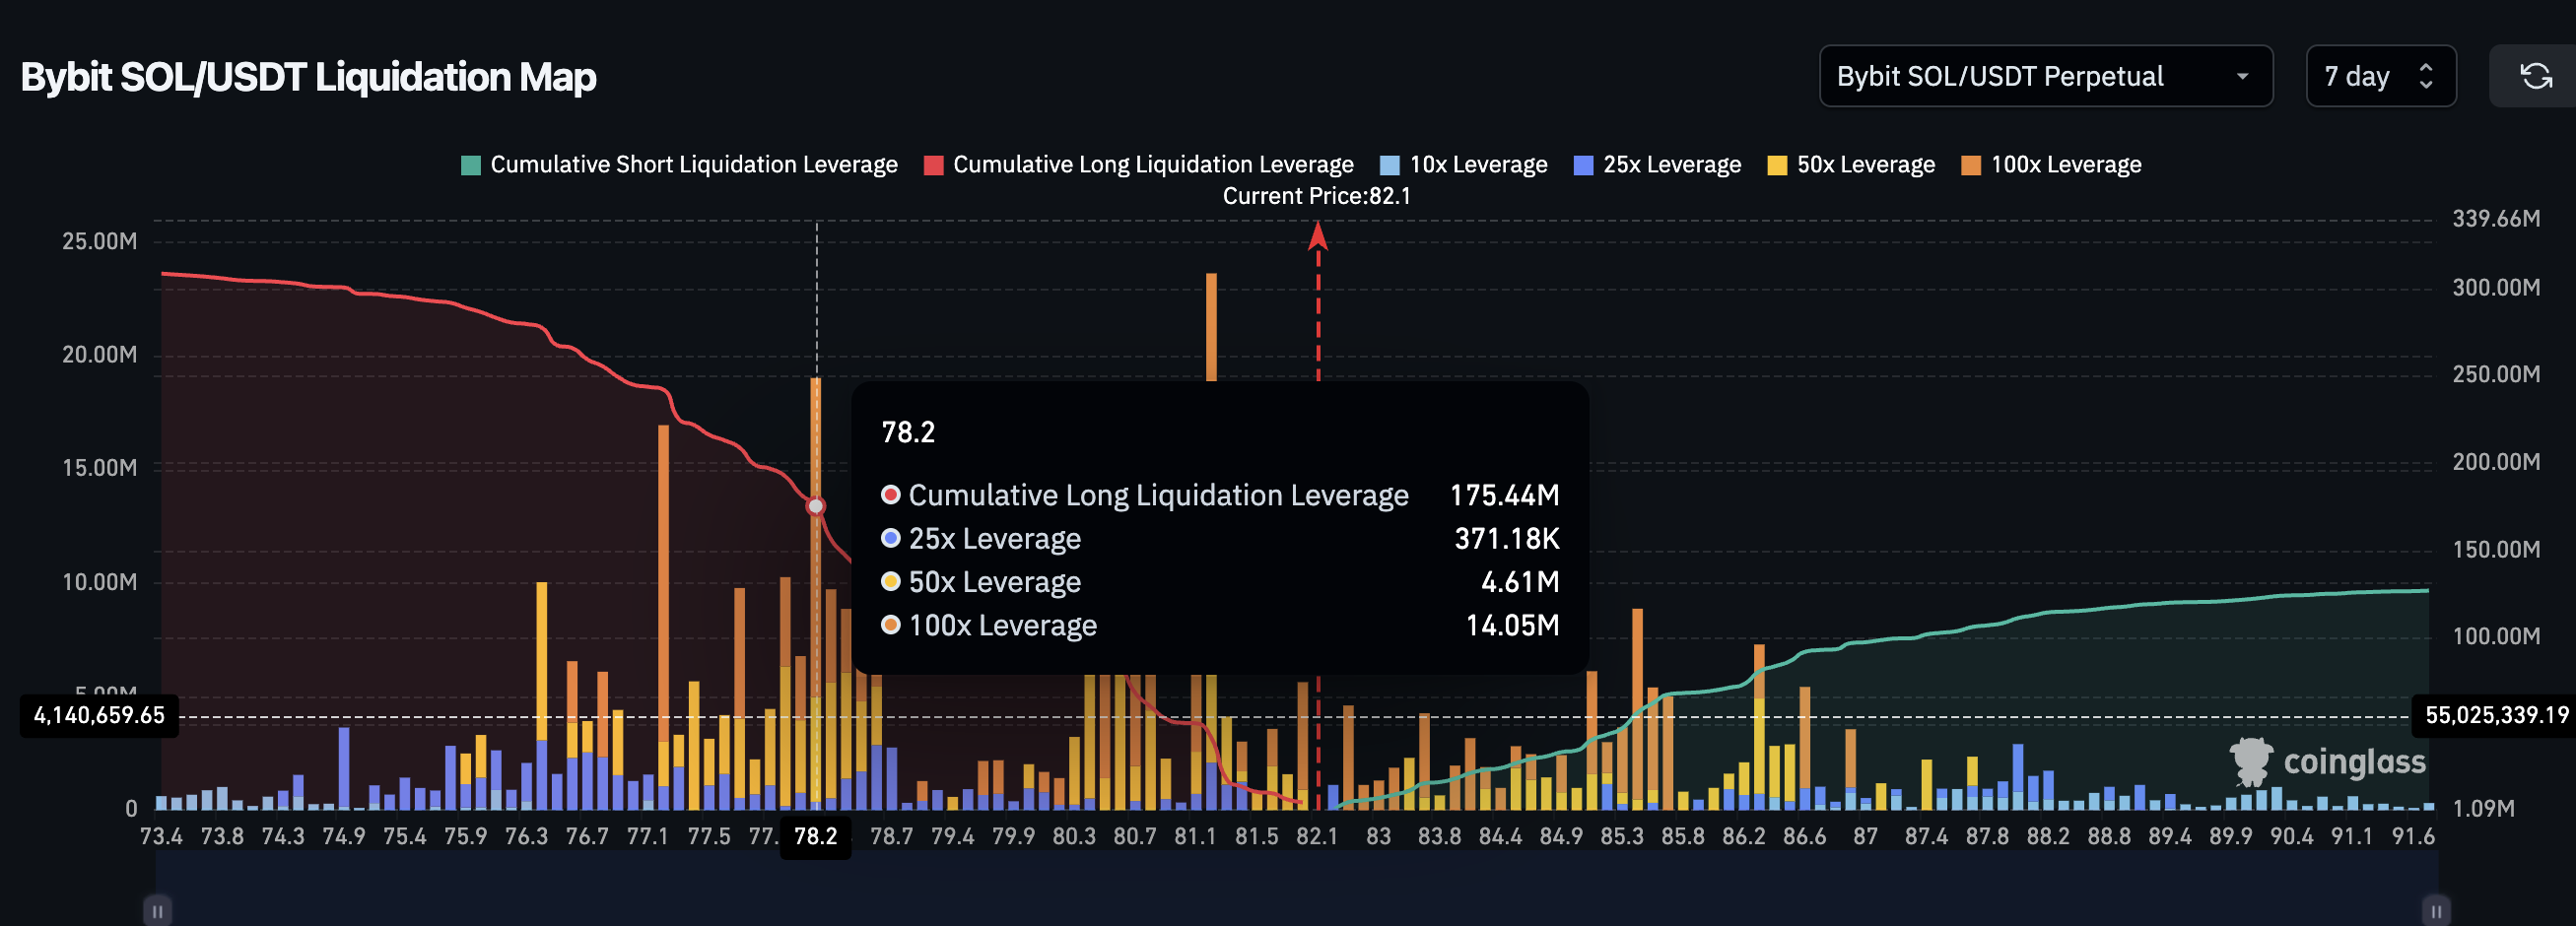
A large group of sell orders worth $175 million is clustered around the $78 price level for Solana. If the price can’t hold above $78, a significant drop could quickly invalidate the current optimistic outlook for the coin.
The SOL price levels now determine which outcome plays out.
Solana Price Levels That Decide if the Longs Are Right
SOL is currently trading at $82.20. The next key price to watch is $84.12, which corresponds to a Fibonacci retracement level. If the price stays above $84.12 for 12 hours, it could signal a bullish pattern is forming and buyers are aiming for a breakout.
The price is currently trading between $86.86 and $88.09. If the price closes above $88.09, it would signal a breakout and potentially lead to a price increase, with a target range of $98.47 to $98.80.
If the price falls below $81.67, it could signal a problem with the current upward trend. This price level represents a key support area and is close to a large volume of SOL tokens being held, which could act as a barrier to further price drops. A sustained drop below this point would strengthen the bearish pattern and suggest the predicted price increase might not happen.
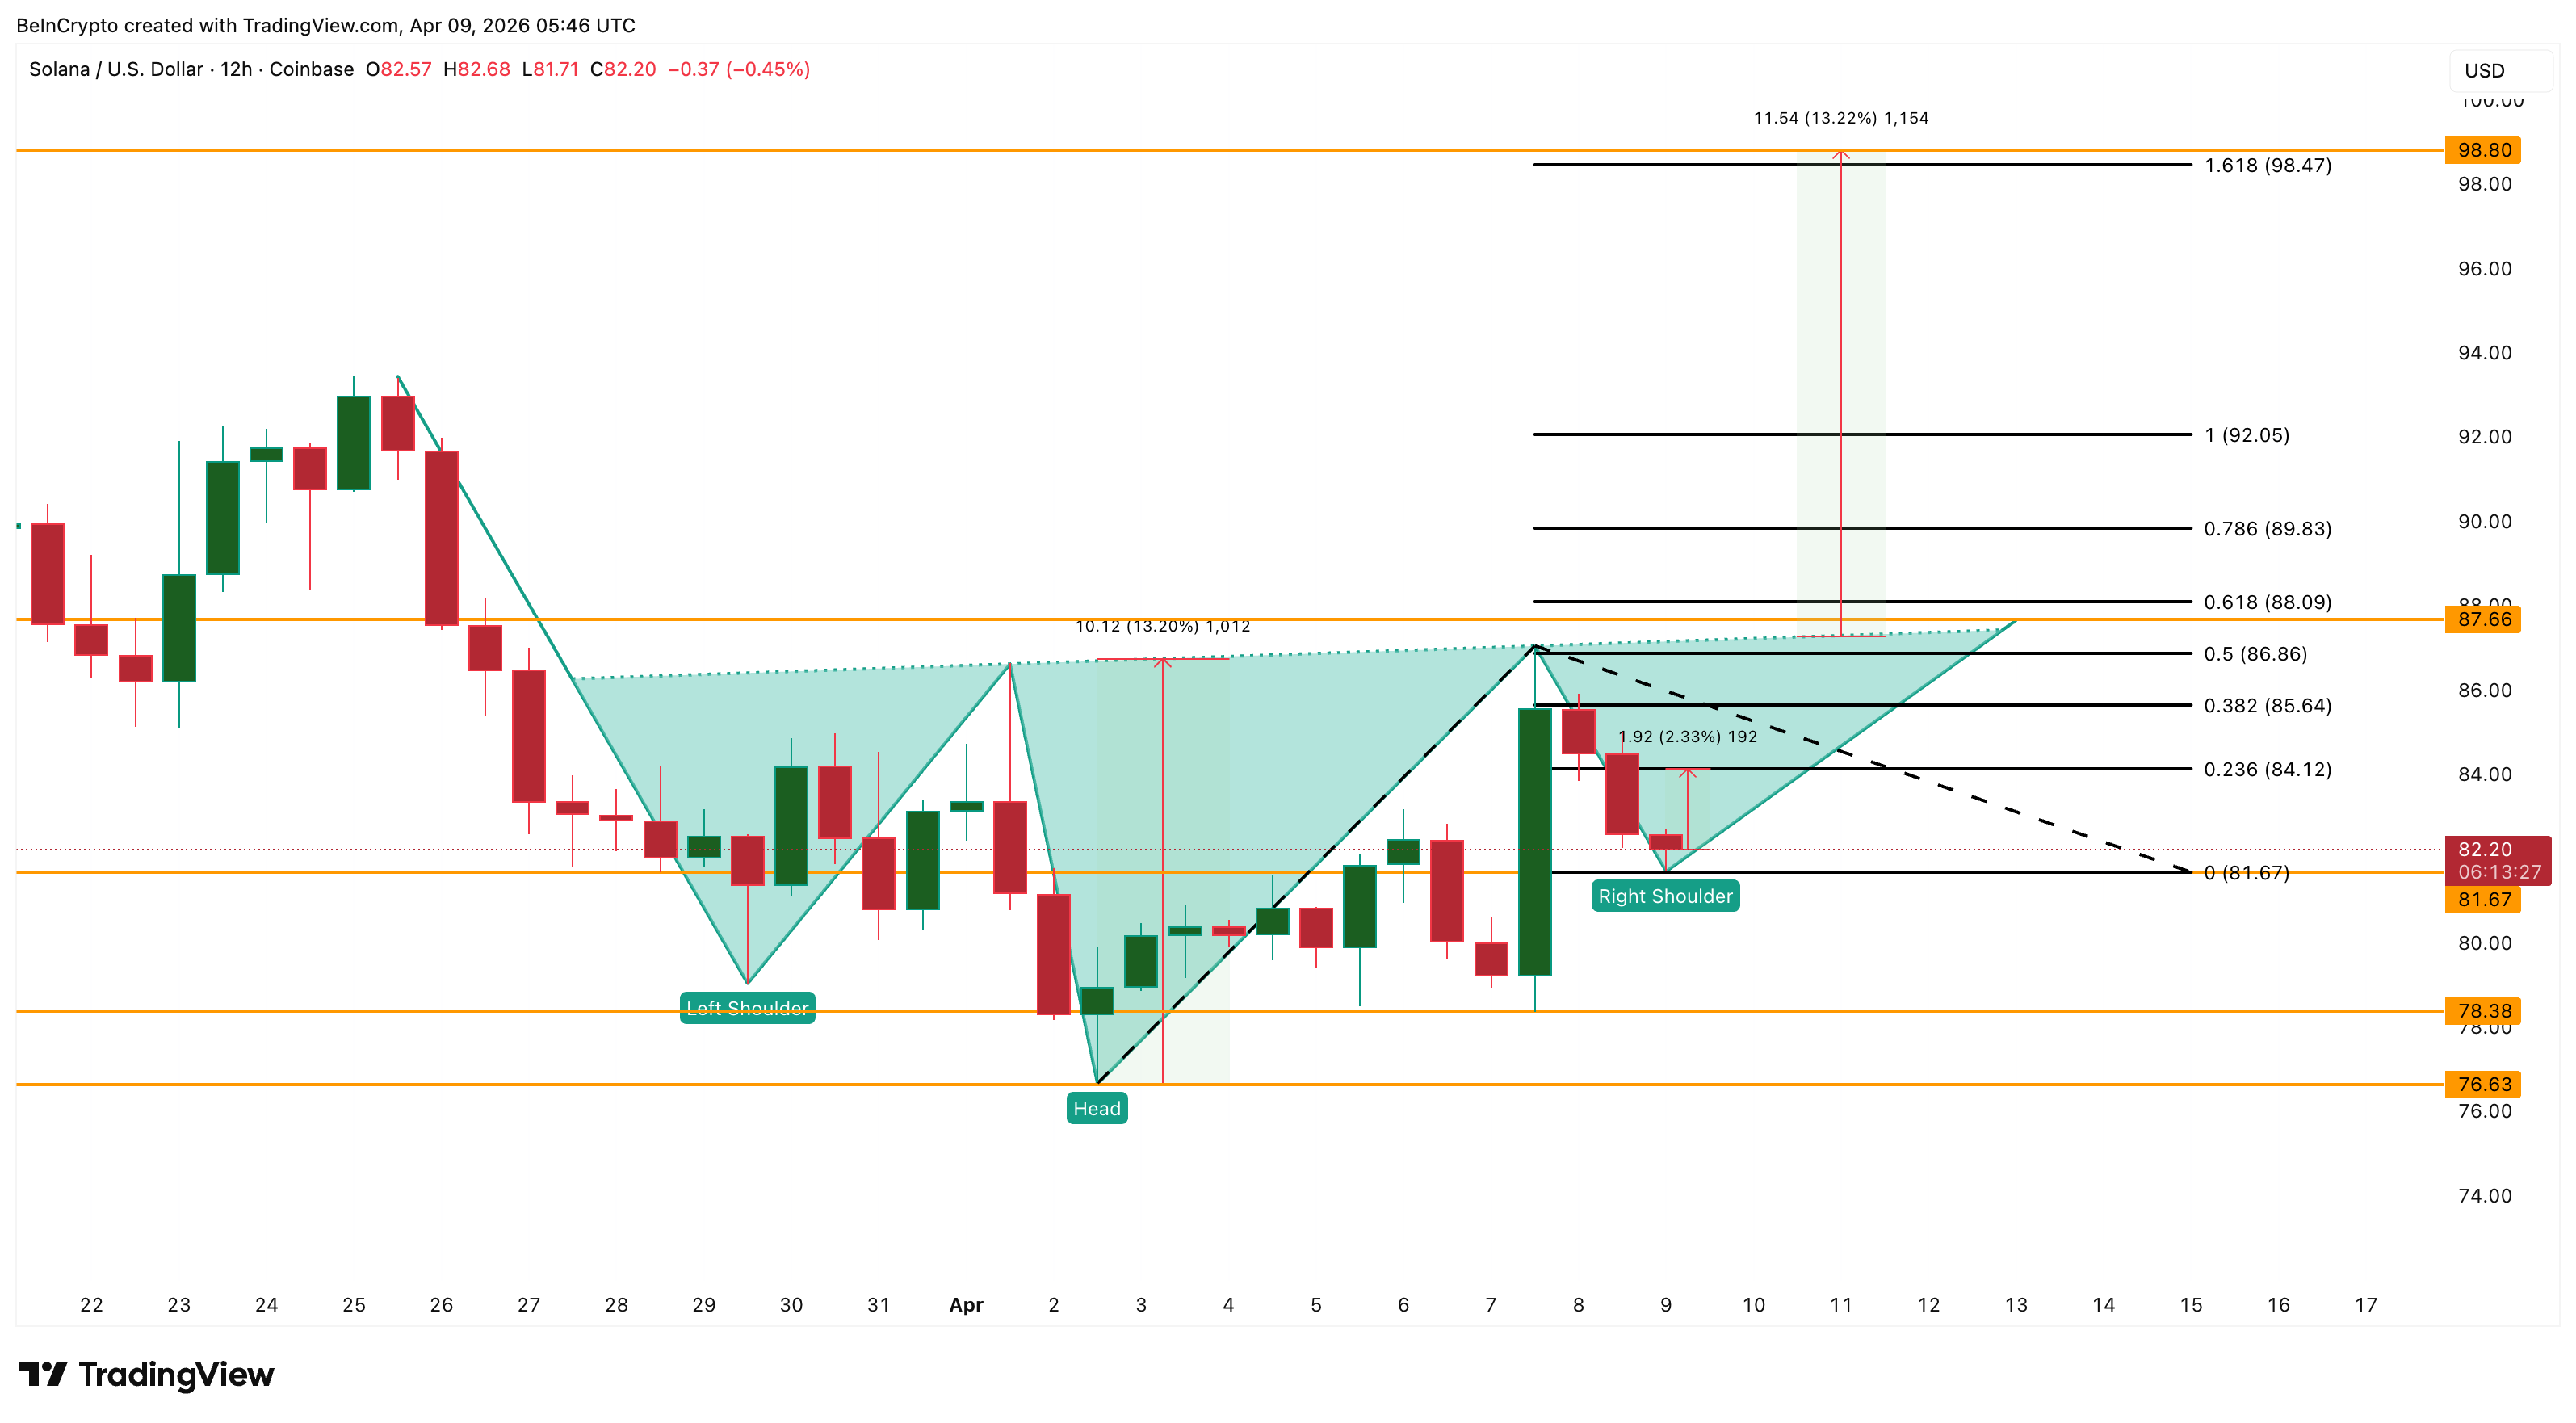
The price around $78.38 could provide some support, but a larger drop is possible near that level. Approximately $175 million worth of open trades could be automatically closed (liquidated) around $78, which would likely push the price down further and disrupt the current upward trend. If the price falls below $76.63, it would completely negate the potential for a positive reversal pattern.
Currently, the price needs to move above $88.09 to confirm an upward trend towards $98.80. If it fails to do so, it could lead to significant selling pressure, potentially liquidating $175 million worth of long positions and driving the price down to $78.
Read More
- Gold Rate Forecast
- Brent Oil Forecast
- EUR CNY PREDICTION
- USD MXN PREDICTION
- IP/USD
- EUR CLP PREDICTION
- Silver Rate Forecast
- EUR HUF PREDICTION
- Tether’s $100M Crypto PAC Unveils New Leader Amid Silent Midterm Saga
- RENDER PREDICTION. RENDER cryptocurrency
2026-04-09 17:28