OMI is launching a new approach to media planning that combines data from various sources, providing more comprehensive and useful insights.
Summary
- OMI combines data from Similarweb, Moz, and proprietary metrics to create a unified media performance index.
- The index solves fragmented media planning by aggregating 37 metrics across reach, SEO, and engagement.
- OMI helps advertisers and analysts compare outlets with standardized data, reducing misleading or inconsistent metrics.
OMI combines data from sources like Similarweb and Moz with its own unique indicators and research. It then uses a standardized approach to build its index.
A frequent challenge in media planning is that many tools focus on separate data points like website traffic, search rankings, or information from publishers. However, these tools often don’t reveal how all these factors work together in a real campaign. This makes it hard to predict how a particular website will perform or what results it’s likely to deliver.
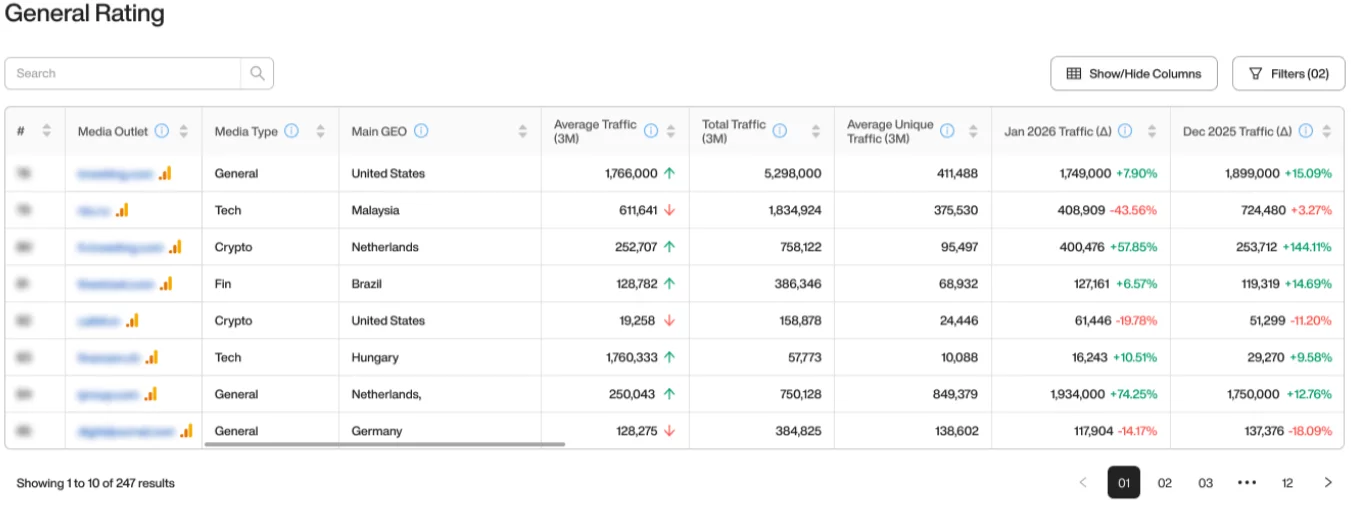
OMI simplifies media planning by centralizing all key data in one location, eliminating the need to gather information from multiple sources. It analyzes over 340 websites – including those focused on crypto, finance, technology, and general news – using 37 different metrics covering reach, engagement, SEO, and operational performance.
Buying media can be complicated and unclear. Different data sources offer conflicting information, vendors don’t always provide accurate numbers, and many popular ‘top’ lists are actually influenced by advertising payments.
OMI is built for teams that work with media decisions directly:
- advertisers,
- PR and marketing teams,
- publishers,
- and analysts,
This refers to the teams responsible for managing content and ensuring its accuracy. The index helps by standardizing data before it’s ranked, which minimizes the effect of exaggerated or inaccurate information.
To better understand how well this works, it’s useful to examine OMI’s methods and how scores are calculated, identify its strengths, and consider any potential weaknesses.
How OMI ranks media outlets
OMI ranks outlets by converting most of its inputs into two consolidated scores:
- General Score summarizes overall outlet strength on a 1–100 scale, and
- Convenience Score reflects how easy an outlet is to work with in practice, also on a 1–10 scale.
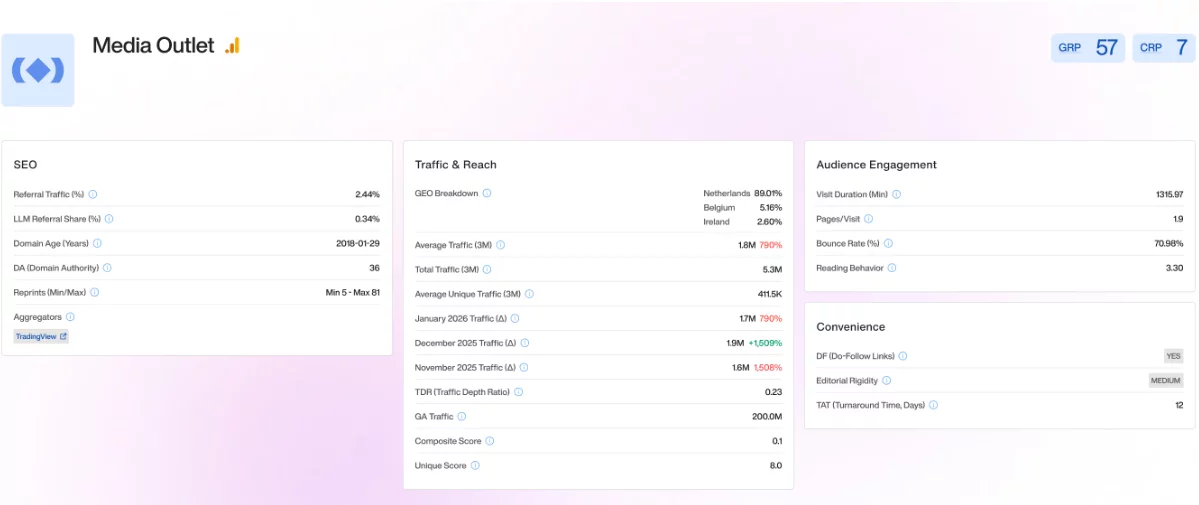
Those scores are based on a combination of OMI’s standard technical indicators and unique measurements, including:
- Unique Score, which reflects the consistency of an outlet’s unique audience over time rather than short-term spikes,
- Composite Score, which combines relative (%) and absolute changes in traffic dynamics to show whether an outlet is growing, stable, or declining,
- Reading Behavior, which captures how deeply users interact with content once they land,
- Reprints Score, which tracks whether coverage tends to circulate beyond the original publication and how impactful that syndication actually is,
- and Editorial Rigidity, which reflects how flexible or restrictive an outlet is during the publishing process.
These normalized indicators rely on standard market signals, including but not limited to:
- Average Traffic (3m) and Total Traffic (3m), reflecting overall reach,
- Average Unique Traffic (3m), showing the size of the real audience,
- Referral Traffic (%), and especially LLM Referral Share (%), indicating how traffic flows from external sources,
- Visit Duration, Pages per Visit, and Bounce Rate (%) as benchmarks for audience behavior,
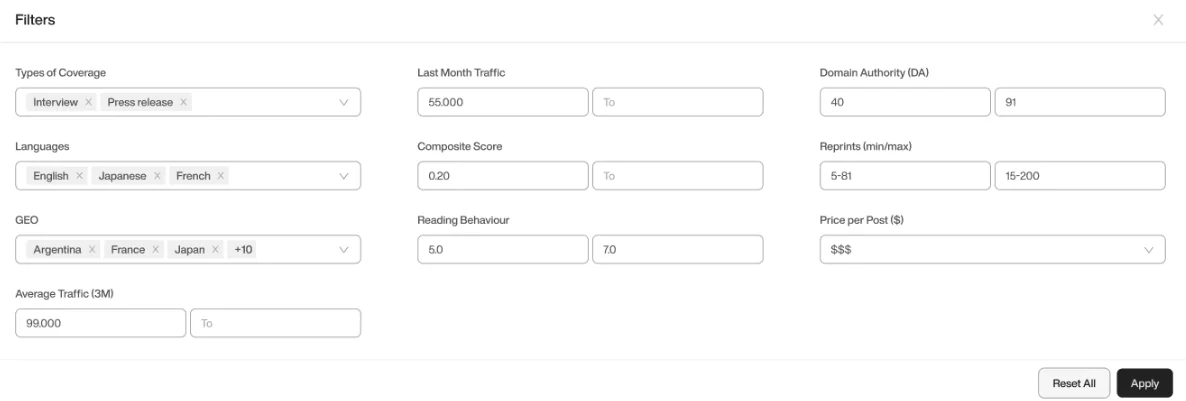
- Main GEO and GEO Breakdown, showing where the audience is concentrated,
- Price Per Post ($), reflecting the cost of placement.
The system uses both an overall score and a convenience score to give outlets two ratings: an overall rating and a convenience rating. This allows for a fair comparison between outlets, focusing on general quality and ease of use rather than things like how fast they operate, their pricing, or how much control they have over content.
Like any ranking system that combines multiple factors, these rankings should be seen as a guide, not a definitive answer. Even the best estimates aren’t perfect, and it’s impossible to predict exactly how well any placement will do. OMI is most useful for consistently evaluating a specific set of options, helping teams narrow down choices and make informed decisions, rather than providing a precise rating of a publication’s overall impact.
Rankings aren’t set in stone; teams can explore and improve them based on their goals. Plus, the way rankings are displayed can be customized to highlight the most important information for each campaign.
From that point, you can often focus on specific sources. Each source can be opened in its own profile, bringing together all the related information in one spot. This makes it simpler to go from a quick comparison to a more in-depth look before you decide on something.
Can OMI rankings be influenced by paid placements or inflated traffic?
As a researcher, I want to clarify that our OMI rankings are completely objective. We don’t accept any payments to influence rankings, and the methodology we use is set in stone – it can’t be altered or adjusted, and no outside parties have any sway over the results. We believe in a transparent and unbiased system.
However, the overall online landscape isn’t protected from attempts to artificially increase website traffic or improve search rankings. While no system can completely block these tactics, our method differs because it doesn’t change rankings based on paid relationships. This is a key reason why it’s considered a more trustworthy source of information in real-world situations.
In my research, I’ve found that looking at multiple signals is much more reliable than focusing on just one. We use OMI to analyze various metrics from different sources, which helps to minimize the effects of artificially boosted visibility. Instead of solely relying on traffic numbers, we consider them alongside other indicators to get a more accurate picture of an outlet’s true performance.
Rather than completely eliminating unreliable information, OMI adjusts how results are ranked to prevent misleading boosts from unfairly influencing what people see.
How often is OMI data updated?
Open Movement Insights (OMI) data isn’t updated all at the same time. Instead, it’s refreshed gradually, depending on what kind of information it is. Things like website traffic, user engagement, and overall scores are usually updated every month. More detailed or complex data, which requires more research, is updated less often – only when new information has been checked and confirmed.
As an analyst, I find a staggered update approach to media data much more logical than trying to cram everything into a single cycle. The reality is, not all data changes at the same rate. Pretending it does can actually be misleading. A staggered approach better reflects how media data *actually* behaves – some signals are fast-moving, others are slower. This ultimately gives us a more practical and reliable picture when we’re making decisions.
Sometimes, you’ll see a dash (—) in OMI data. This just indicates that we don’t have enough good information to accurately report a value for that particular measurement right now. Rather than guess or use unreliable data, OMI leaves those fields blank until we can be sure the information is accurate.
Not filling in those fields prevents less established businesses from appearing more significant than they are, and ensures comparisons are based on actual performance, not just estimates.
When should OMI be used in media planning?
OMI is most helpful when you’re still deciding where to place your media. This typically involves creating a shortlist of potential outlets, comparing options within similar price ranges, and making sure a placement seems likely to perform well before you commit any money.
This is especially useful when expanding into new regions or using different platforms. Keeping track of variations between locations becomes difficult, but considering location, customer habits, and practical considerations can help you focus your efforts. Outset Data Pulse provides valuable insights into how these different markets actually perform.
Essentially, OMI is most useful as a tool to guide comparisons, not to make the ultimate decision. It organizes information and points out the pros and cons, but the final choice always depends on the specific situation, what you’re trying to achieve with your campaign, and how you’re presenting your story.
Media planning is often complex and doesn’t provide easy solutions. However, using a consistent approach to analyze data can help you feel more confident in your choices. Tools like OMI can be valuable in this process – not by giving you definitive answers, but by providing a more solid foundation for making informed decisions.
How OMI becomes even more reliable from here
In a recent interview, OMI founder Mike Ermolaev clarified that their goal wasn’t to simply add another tool to the many already in use. Instead, OMI aims to create a streamlined system where data is organized and works together seamlessly.
As he put it, “OMI is not just another tool in the stack. It’s designed to replace the stack.”
Reliability isn’t about finding one perfect measurement; it’s about building a consistent process. When teams use the same data and approach, trust in their media planning improves.
According to Sofia Belotskaia, OMI’s product manager, the next step is to improve the platform’s usability. This includes simplifying how users compare performance, enhancing the way historical data is displayed, and refining how audiences are categorized.
As I see it, the next phase of OMI isn’t simply focused on expanding its capabilities. It’s about improving clarity and reducing ambiguity. That’s crucial for any media planning tool hoping to establish long-term trust with its users – people need to easily understand the information and be confident it’s accurate.
Our future plans involve letting news organizations share their own information – like audience data, pricing, and content guidelines – within a controlled system. Eventually, this could change how media and advertisers work together, possibly creating a platform where ad space can be bought and sold more easily.
Read More
- Pi Hotel Vietnam: First to Accept Pi Coin Payments in Real-World Transactions
- Silver Rate Forecast
- Gold Rate Forecast
- USD IDR PREDICTION
- USD TRY PREDICTION
- Warsh’s Fed Debut: A June Rate Cut? Don’t Hold Your Breath, Darling
- 3 MASSIVE Token Unlocks That Could Blow Up the Market: HYPE, ENA, RED!
- The Quiet Rise of Ethereum: Is it Really Gone or Just Getting Started?
- Ripple’s CEO Reveals Shocking Truth About CLARITY Act!
- SOL GBP PREDICTION. SOL cryptocurrency
2026-03-30 12:49