Ethereum’s price is currently staying above $2,000, but its future direction is unclear based on typical price charts. However, data from cryptocurrency exchanges suggests a more positive outlook.
A recent CryptoQuant report suggests the recent market downturn might not be as straightforward as it seems. On March 22nd, a massive $1.67 billion worth of Ethereum was withdrawn from the OKX exchange in a single transaction – the largest single withdrawal seen in the report’s timeframe. Binance also showed signs of activity, with two separate withdrawals exceeding $300 million each on February 5th and 7th.
Three large withdrawals. Two major exchanges. One direction.
When a large amount of ETH leaves exchanges, it doesn’t vanish. Instead, it’s moved to secure storage, used for staking, or held for the long term. This reduces the number of coins readily available for sale, making the market more responsive to any new purchases.
As I’ve been analyzing the recent withdrawal data, I’m seeing a subtle tightening of Ethereum’s supply. What’s particularly interesting is this is happening while the price remains above the $2,000 mark. This isn’t just about the number $2,000; it’s about what that number *means*. An Ethereum price at $2,000 with decreasing supply on exchanges feels very different from a $2,000 price supported by readily available sellers. The price itself hasn’t changed, but the underlying market dynamics definitely have.
One Exchange Would Be a Data Point. Two Is a Pattern.
The report clearly explains why tracking withdrawal signals is important. A large withdrawal from one exchange could be due to various reasons – like an institution moving assets, someone reorganizing their wallets, or a single investor making a transfer unrelated to market trends. However, it’s hard to ignore a pattern of similar withdrawals happening across several major exchanges within the same three-month period.

OKX saw the biggest single withdrawal during this time. Binance experienced two large outflows, each over $300 million, within just two days in early February. When multiple exchanges show similar, large reductions in available crypto at the same time, it’s unlikely these are just isolated incidents. The more likely explanation is that there’s a significant decrease in the amount of ETH readily available for immediate purchase on the market’s most liquid exchanges.
The report emphasizes what this information doesn’t imply as much as what it does. A decrease in supply held by exchanges isn’t a reason to expect prices to immediately increase. Instead, it’s a fundamental shift that lessens the amount of potential selling, making the market more sensitive to any increase in buying. This doesn’t guarantee prices will go up, but it makes it easier to prevent them from falling.
If current trends continue, Ethereum isn’t just trading above $2,000 – there are fewer and fewer coins available for sale at that price, suggesting increasing scarcity.
The Ethereum Trend Has Not Changed
Ethereum is currently trading at $2,079, which is a 4.13% decrease from its opening price today. It started the day at $2,169, briefly reaching $2,172, but has been steadily declining since. This price pattern – starting near the high and ending near the low – suggests that sellers are now in control, rather than a period of stable trading.
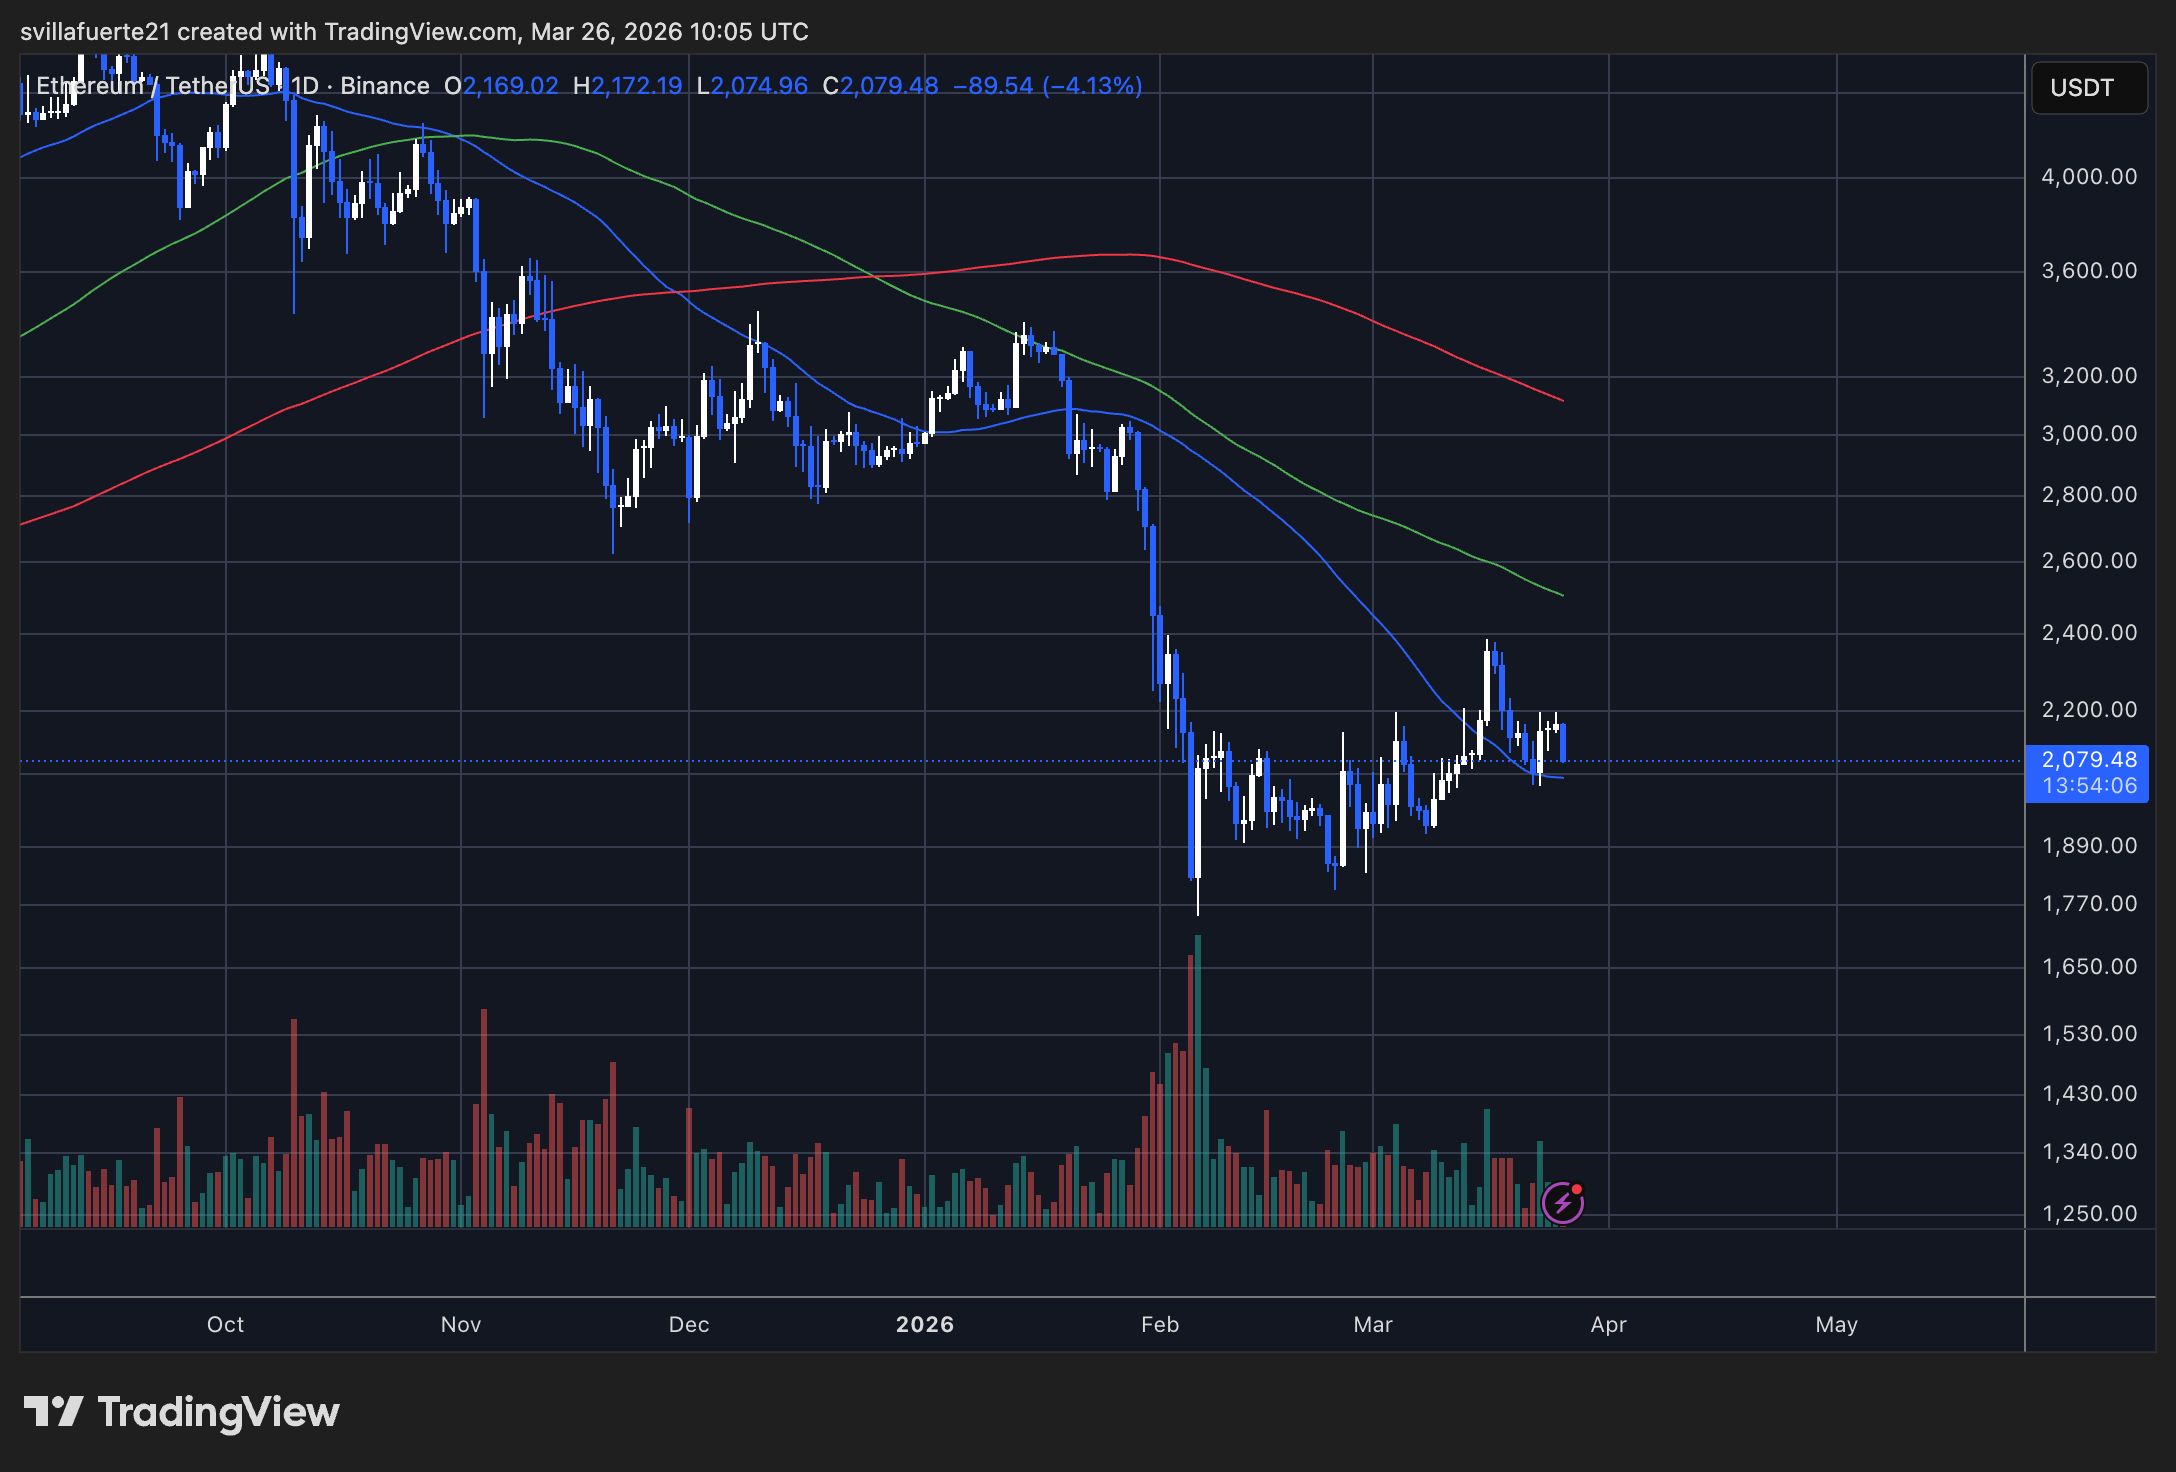
Looking at the daily price chart, the trend for ETH is clear. It reached a high of around $4,100 in September 2025 and has been steadily falling for the past six months. The sharpest drop happened in February, with a near-vertical plunge from $3,000 to $1,770 accompanied by very high selling activity. While the price did bounce back from that low point, the recovery has been slow, limited to a narrow range, and doesn’t seem very strong.
The market’s downward trend is confirmed by several indicators. A key bearish signal, the 50-day moving average dropping below the 100-day moving average, has occurred, suggesting further declines. The 200-day moving average, currently around $3,200, continues to act as a strong resistance level, and the price hasn’t been able to break above it since November. Every attempt to push prices higher has failed well before reaching this level.
The 4.13% drop today, happening as the price stays below all its moving averages, isn’t a random fluctuation. It signals a clear downward trend. The first key level to watch is $2,000. If the price falls below that, it could soon test the February low of $1,770.
Read More
- Gold Rate Forecast
- Pi Hotel Vietnam: First to Accept Pi Coin Payments in Real-World Transactions
- Silver Rate Forecast
- USD IDR PREDICTION
- Warsh’s Fed Debut: A June Rate Cut? Don’t Hold Your Breath, Darling
- EUR UAH PREDICTION
- Ripple’s CEO Reveals Shocking Truth About CLARITY Act!
- USD TRY PREDICTION
- Are Bitcoin Investors Losing Sleep Over Spot ETF Flatlines? Find Out!
- Pi Network Drops Desktop Studio-Build Apps Like a Pro in Minutes!
2026-03-27 00:05