- Oh, the drama! ETH slipped on a $2,300 banana peel, now wobbling at $2,148. Those pesky sellers are having a jolly good time!
- In the last 90 days, Ethereum’s taken a 26.56% tumble-ouch! But hey, it’s up 10.47% in 30 days. Mixed signals? More like a tipsy tightrope walker!
- Binance traders are all “long” on ETH, with a ratio of 1.5981. Crowded? More like a clown car trying to fit through a keyhole resistance!
There it goes, Ethereum, teetering near $2,148 after a failed flirtation with $2,300. Those sellers? Still calling the shots. Short-term stability? Just a wobbly pause in this bearish ballet.
The $2,300 Fiasco: A Liquidity Sweep Farce
Ethereum briefly danced above $2,300, only to trip and fall flat on its face. A liquidity sweep? More like a slapstick comedy where stops were triggered, and the price did a backward somersault. Weak buying strength? You could say that again!
1D SETUP | FAKEOUT CONFIRMED, STRUCTURE SHIFT AWAITS! ETH’s trading at $2,148 after a fakeout between $2,230-$2,400. Liquidity grab? More like a bear’s picnic! Multiple Break of Structure (BOS) confirmations? Bears are having a field day…
– Crypto Patel (@CryptoPatel)
The $2,230 to $2,400 range? Now a supply zone where sellers lurk like hungry wolves. Buyers tried to hold the fort but were shooed away like flies at a picnic. Pressure? It’s raining bears!
Short-term data? A 4-hour change of +0.02% and a 24-hour gain of +0.73%. Consolidation? More like a snooze fest with no momentum in sight.
Multi-Timeframe Trend: A Mixed Bag of Tricks
Short-term stability? A mere hiccup. Mid-term? Down 6.70% in 7 days, but up 10.47% in 30 days. Pullback? Correction? It’s like Ethereum can’t decide if it’s a bull or a bear-or just a confused circus animal!
Longer-term? Down 26.56% in 90 days and 44.09% in 180 days. Year-to-date? A 27.09% dip. Bearish structure? You bet! The trend’s as stubborn as a mule since the $4,957 peak.
Key Zones: Where the Magic (or Mayhem) Happens
A fair value gap between $2,474 and $2,634? That’s where buyers might try to flex their muscles. Above that, $2,898 to $3,034 is a resistance fortress. Downside? $1,840 is the line in the sand. Break it, and $1,300 awaits. Descending trendline? It’s like a stubborn gatekeeper, keeping upward dreams in check.
Sentiment Data: Longs Are the New Black
Traders are all aboard the long train, with Binance showing a 1.5981 long-to-short ratio. OKX? 1.43. Even top traders are leaning long, with ratios of 1.6069 and 1.0949. Upside bias? More like a crowded lifeboat!
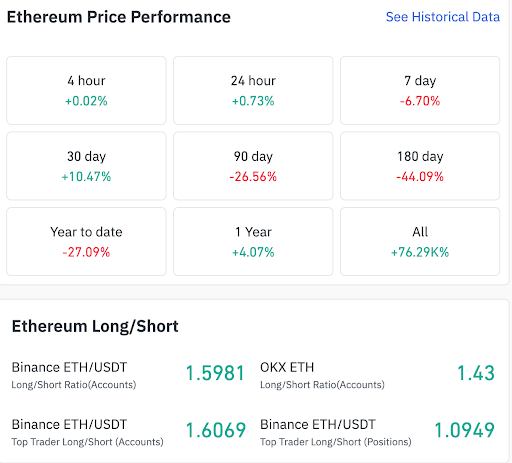
Despite the long love affair, the broader trend is as weak as a wet noodle. One-year return? A measly 4.07%. But hey, long-term? A whopping 76.29K% gain. Historical growth? Now that’s a silver lining in this cloudy circus!
Read More
- Pi Hotel Vietnam: First to Accept Pi Coin Payments in Real-World Transactions
- Silver Rate Forecast
- Gold Rate Forecast
- USD IDR PREDICTION
- Warsh’s Fed Debut: A June Rate Cut? Don’t Hold Your Breath, Darling
- USD TRY PREDICTION
- USD MXN PREDICTION
- SOL GBP PREDICTION. SOL cryptocurrency
- 3 MASSIVE Token Unlocks That Could Blow Up the Market: HYPE, ENA, RED!
- The Quiet Rise of Ethereum: Is it Really Gone or Just Getting Started?
2026-03-26 09:18