In the dust-choked plains of the crypto market, Bitcoin trudges onward, a beast with a fever. Its recent stumble-a gut-punch sell-off-has left it gasping at the $60K watering hole, where parched buyers once clustered like crows. The land is brittle, the air thick with the scent of panic. Technical charts, on-chain liquidity, and higher-timeframe demand all converge like a storm cloud, and the coming days will decide if this is a bear’s den or a bull’s last stand.
The Daily Chart: A Canyon Carved by Fear
Bitcoin, once proud and plump, now scrambles down a canyon wall of its own making. The $75K plateau, once a fortress, has crumbled beneath the weight of sellers. The coin’s impulsive dive toward $60K-historically a haven for hopeful buyers-now feels like a trapdoor. This region, a sacred ground where bulls once roared, now echoes with hollow thumps. Should the price rebound here, it’ll be less a phoenix rising and more a drunkard staggering home after a bar fight.
This $60K zone, a relic of past glory, is now a graveyard of forgotten longs. Bulls may rally, but their cheers will sound like wind whistling through empty bottles. Until Bitcoin climbs above the descending channel’s shadow and the 100- and 200-day moving averages, the bear holds the reins. If the buyers fail to absorb the selling, the coin’s next stop might be $55K-a town so bleak even the bears might mutter, “Too far, too fast.”
BTC/4-Hour Chart: A Desperate Dance with Ghosts
On the 4-hour chart, Bitcoin’s moves are a jittery waltz with ghosts. The $60K mark, a psychological milestone, is now a battleground where bulls charge like drunken cowboys, only to trip over their own boots. A minor bounce? Sure. But it’s the kind of bounce that ends with a faceplant into a supply zone at $75K-a place where sellers lurk like wolves in a corral.
If the coin falters here, it’ll be treated as a minor hiccup in a larger bearish symphony. Should it hold the $60K line? Call it a truce, not a victory. But if the price breaks below, the descent to $55K becomes a slippery slope where even the most optimistic trader might start humming a dirge.

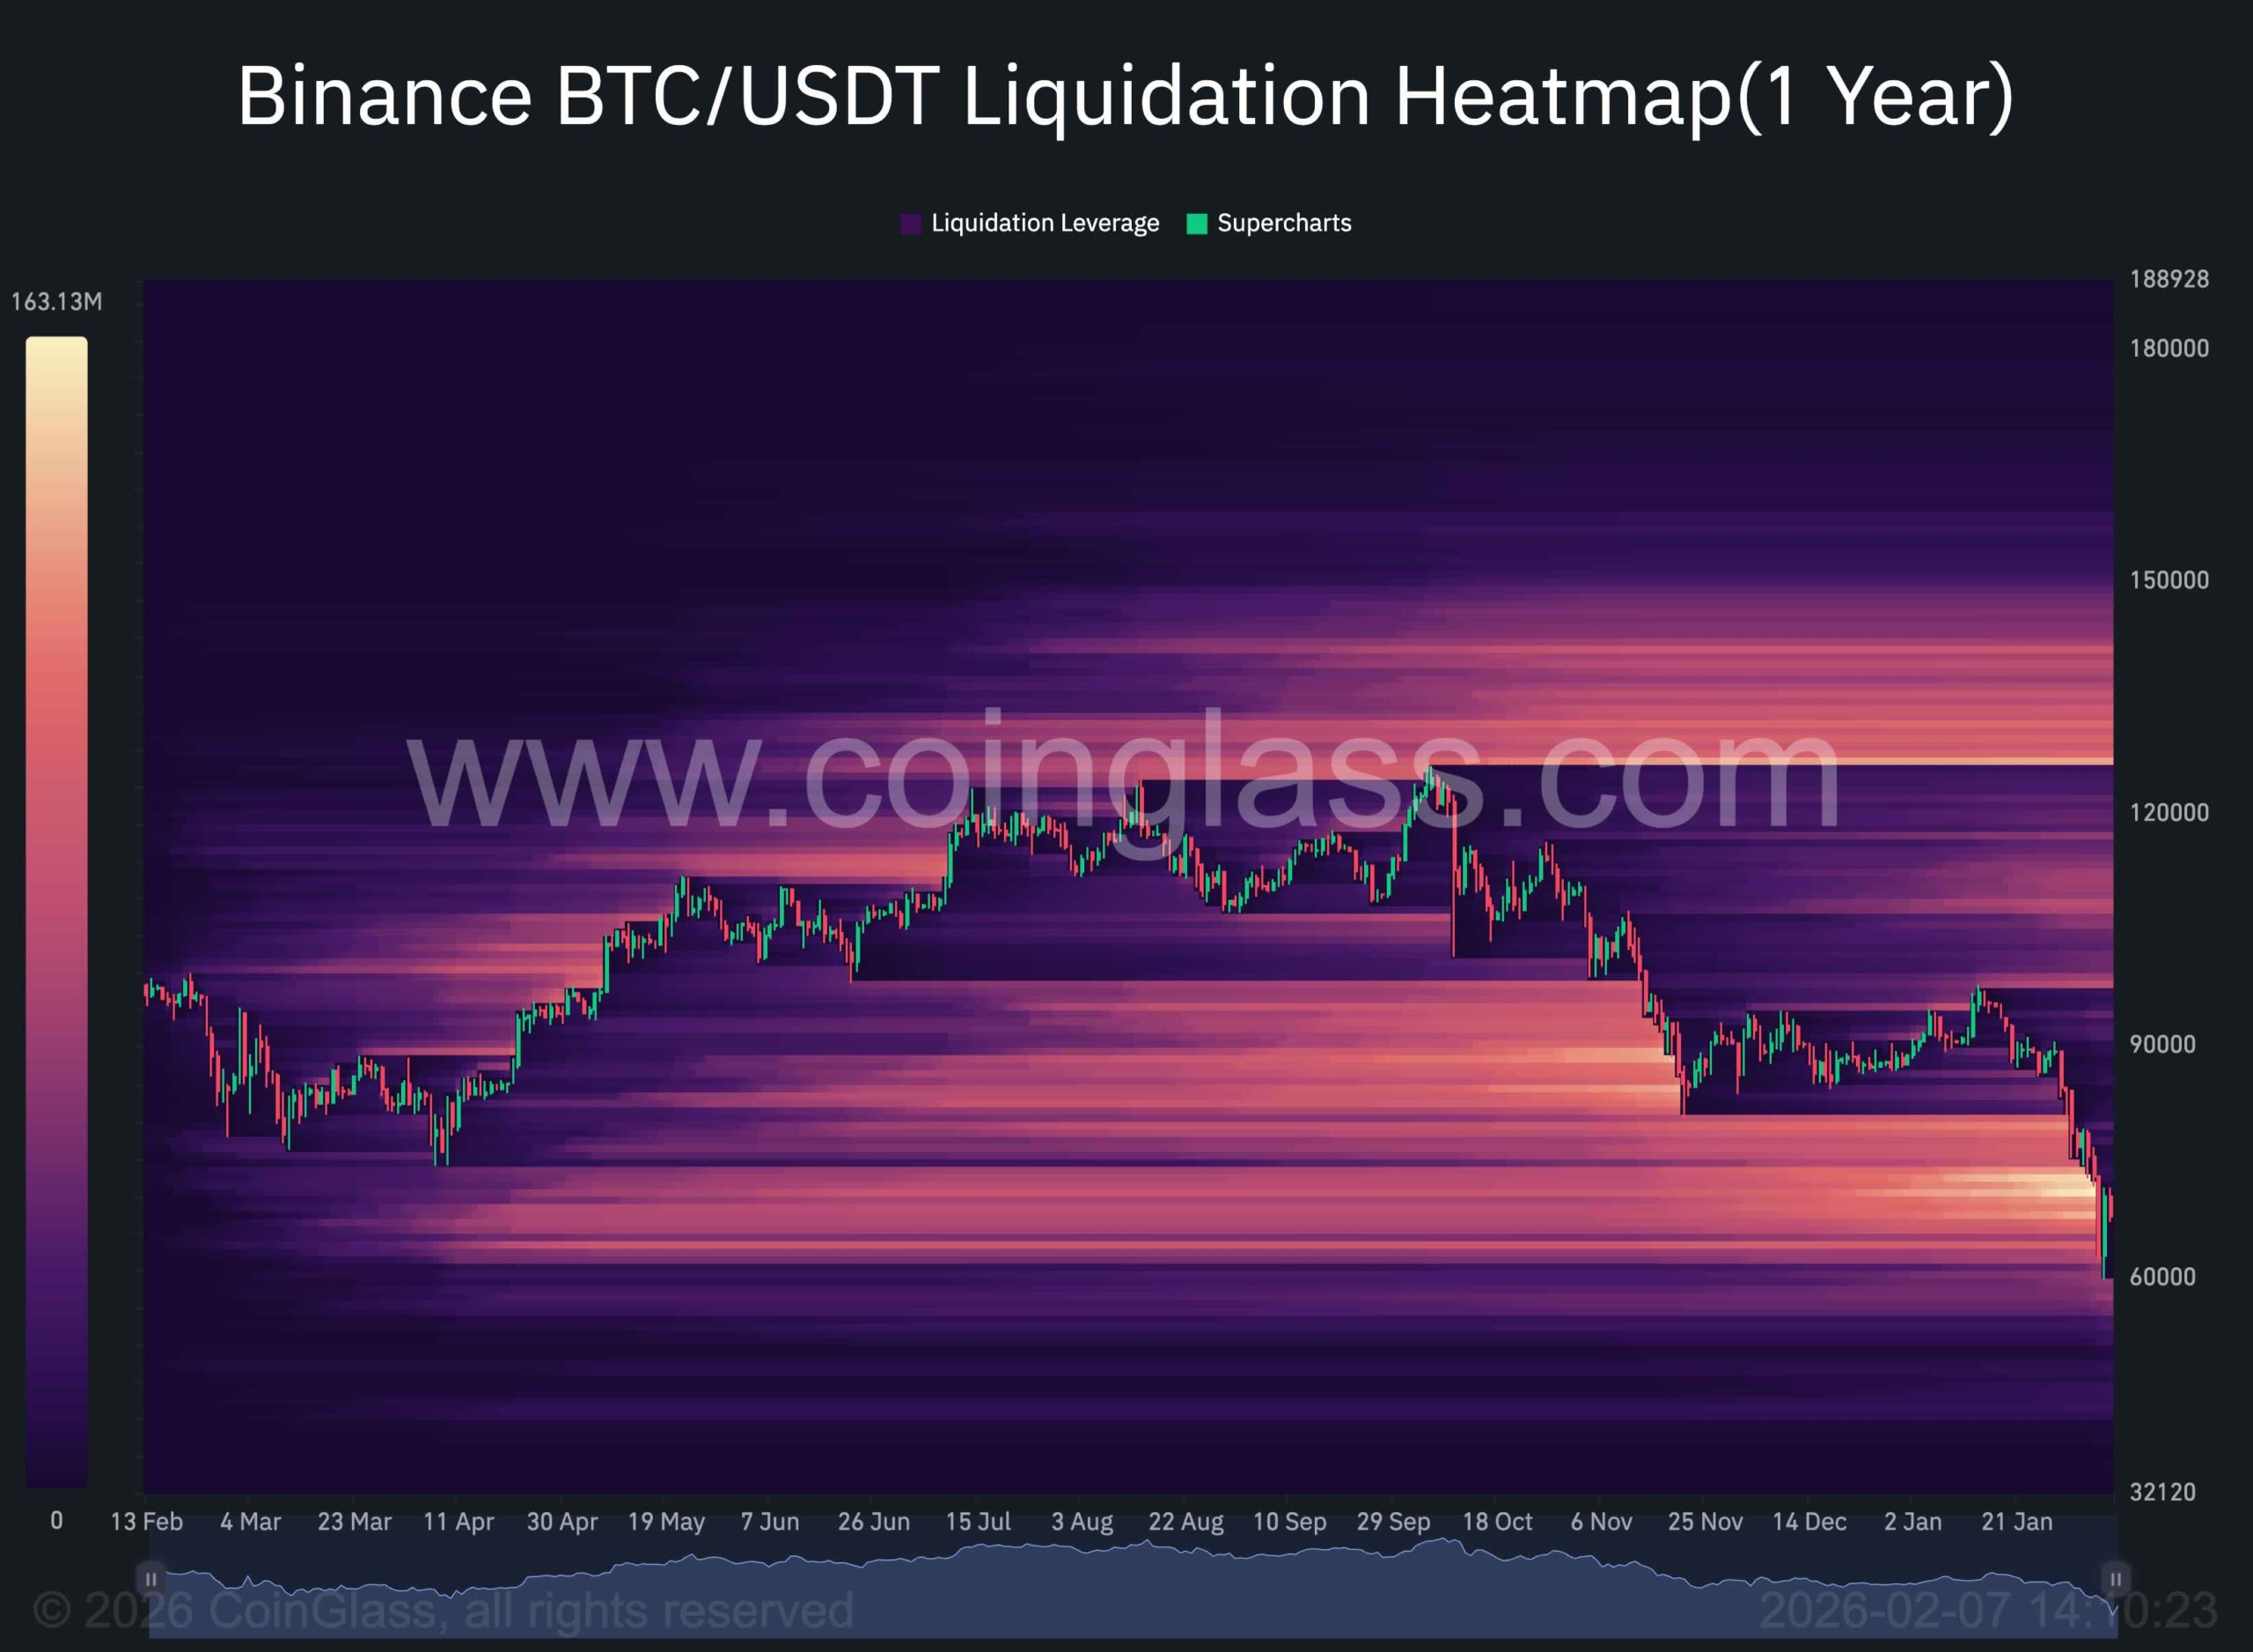
Sentiment Analysis: A Harvest of Broken Dreams
The liquidation heatmap is a map of carnage. Around $60K-$65K, the land is littered with the remains of over-leveraged longs-victims of a sell-off that turned their dreams to ash. This zone, once a magnet for greed, now hums with the low growl of forced liquidations. Yet, as the price nears this wasteland, the screams of liquidation quiet. Perhaps the bears have taken their toll, and the survivors are too numb to cry anymore.
Upside liquidity? A mirage. There’s nothing but desert there. Any rebound will be a flicker in the dark, a spark that dies before it can ignite a fire. But here’s the twist: the coin, like a stubborn mule, might snort and refuse to die. The convergence of historical demand and fading leverage could coax it into a brief respite-a nap in the shade, not a revolution.
Read More
- Pi Hotel Vietnam: First to Accept Pi Coin Payments in Real-World Transactions
- Brent Oil Forecast
- TAO PREDICTION. TAO cryptocurrency
- USD TRY PREDICTION
- EUR CNY PREDICTION
- PI PREDICTION. PI cryptocurrency
- EUR NZD PREDICTION
- EUR CLP PREDICTION
- USD ILS PREDICTION
- XRP Volatility: Can You Handle the Chaos or Just Cash Out? 🤯🚀
2026-02-07 20:29