So, Ether’s hanging out at $4,392, looking all casual with its $530 billion market cap and $26.51 billion trading volume. It’s like it’s at a party, standing between $4,367 and $4,489, sipping a drink and pretending it’s not noticing the technical indicators whispering, “Something’s brewing, mate.” 🍸
Ethereum: The Never-Ending Soap Opera 🎭
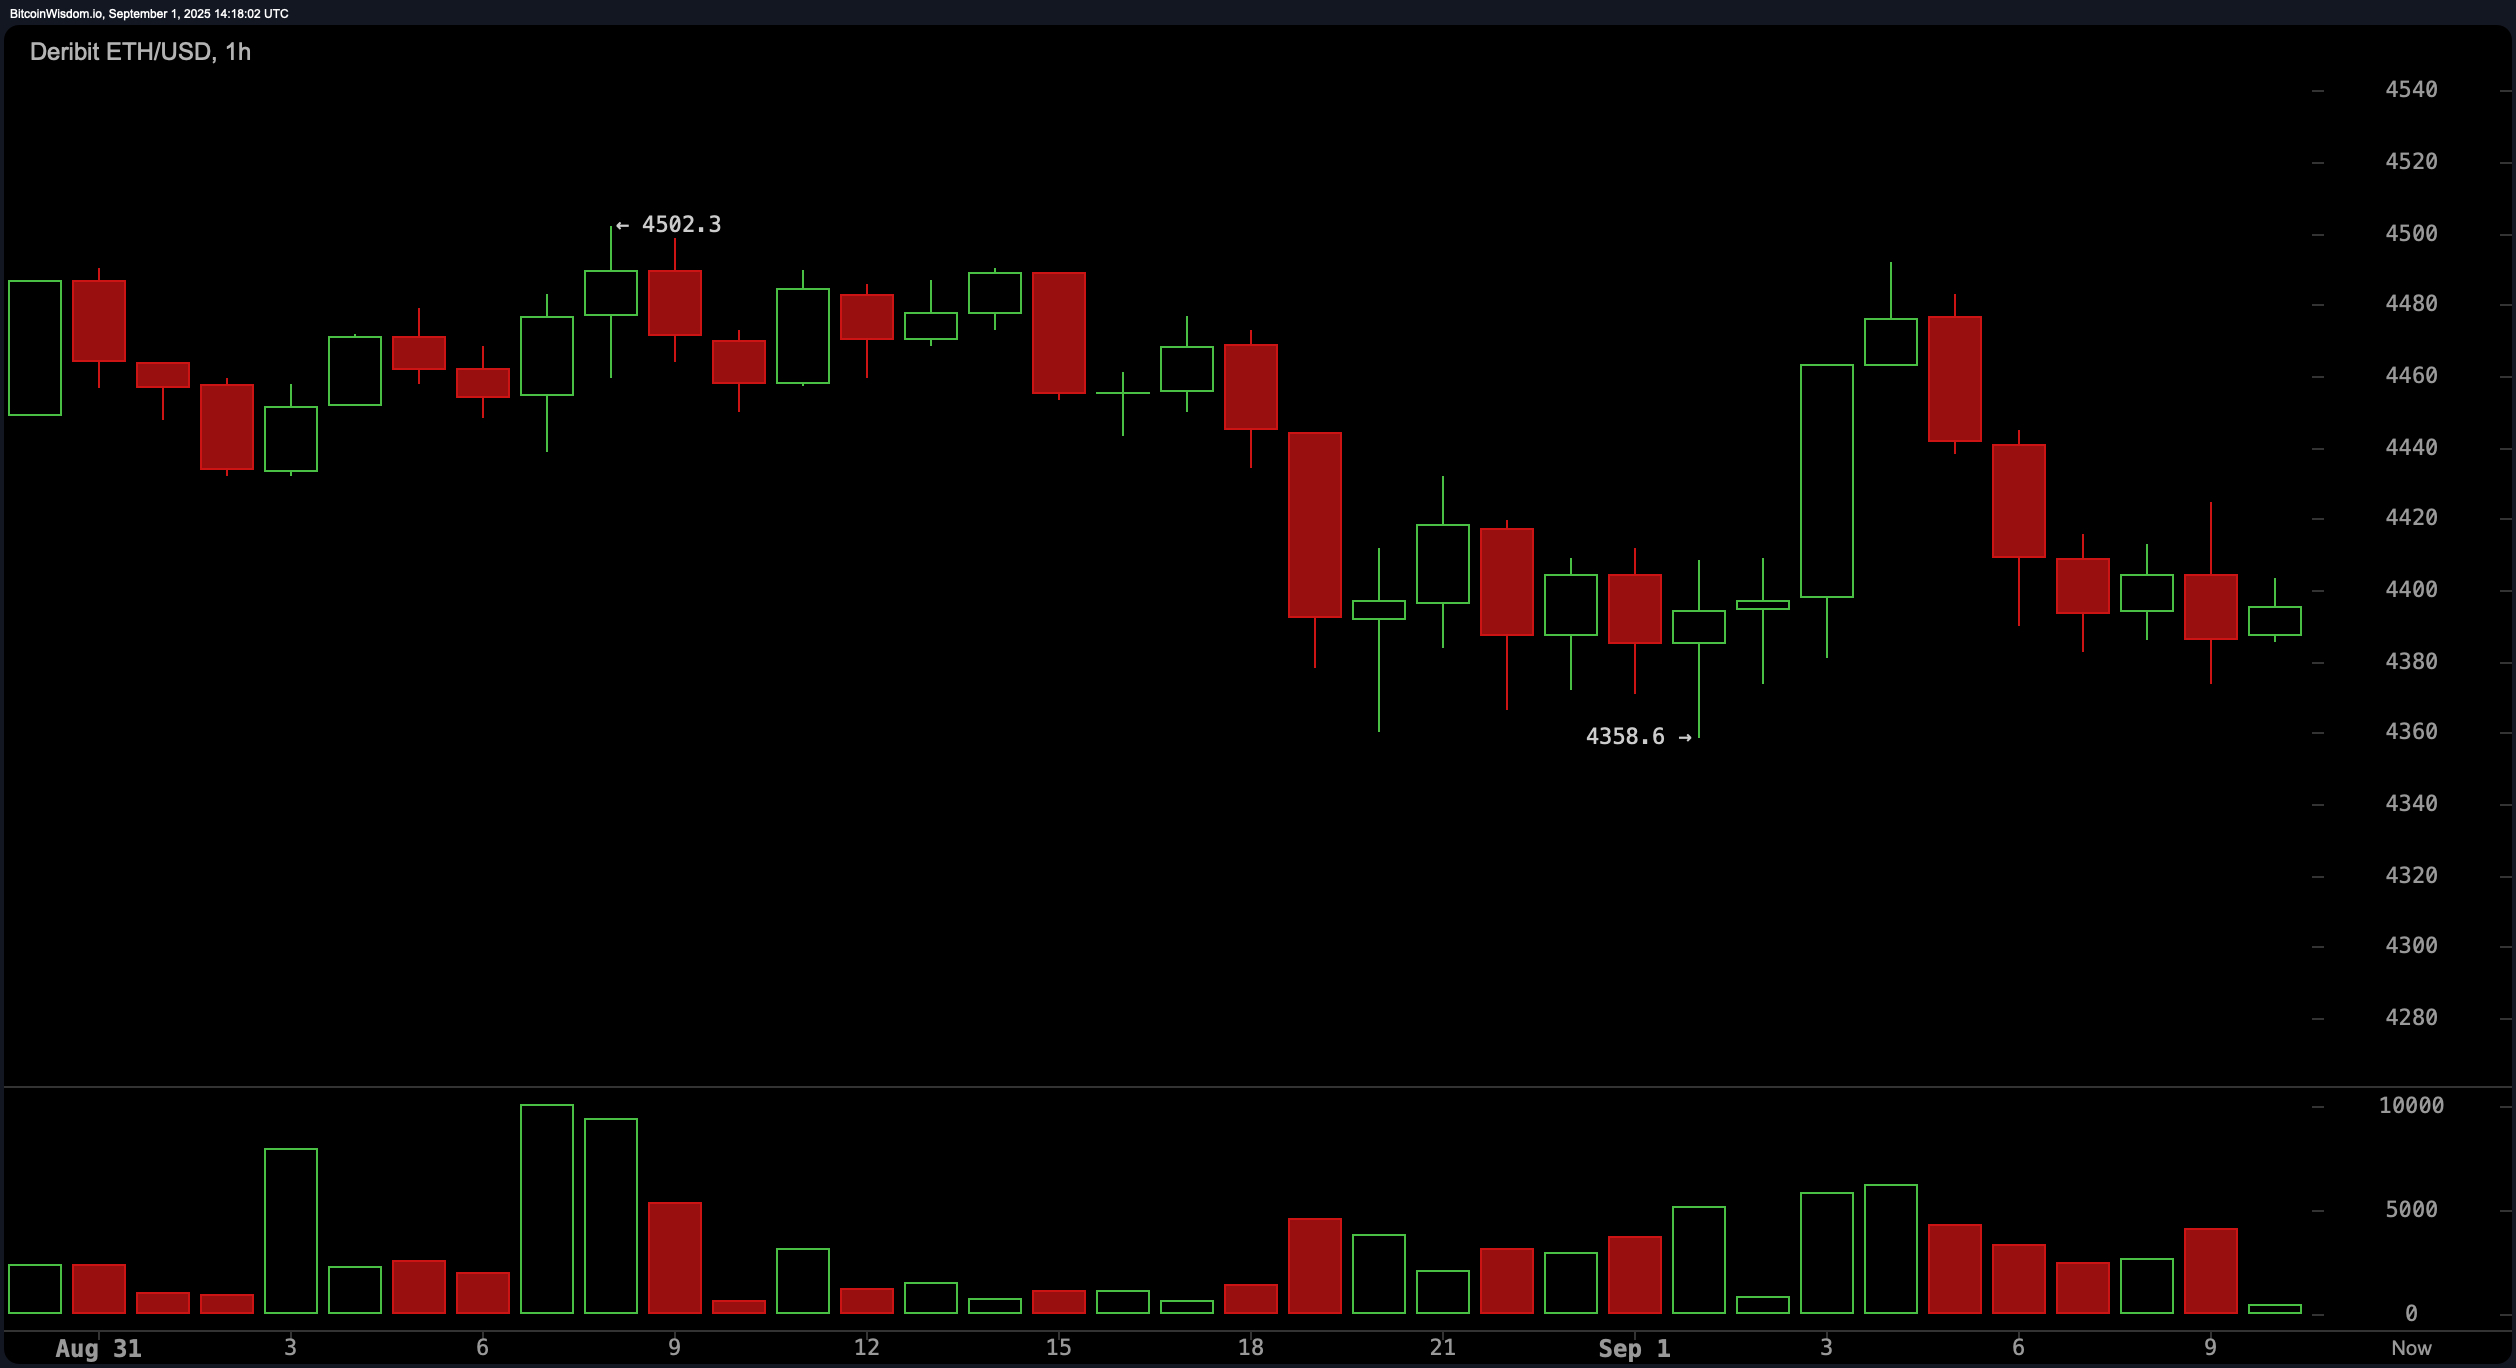
The 1-hour ether chart is basically a drama queen right now. It tried to bounce back from $4,358.6 but got stage fright and stalled around $4,400. Volume’s like, “Nah, I’m good,” and the microstructure’s whispering “bearish flag” or “descending triangle.” If it dips below $4,350, it’s heading for $4,300 or even $4,250. But hey, if it breaks above $4,420-$4,430 with some serious volume, it might just pull a plot twist. 🎉
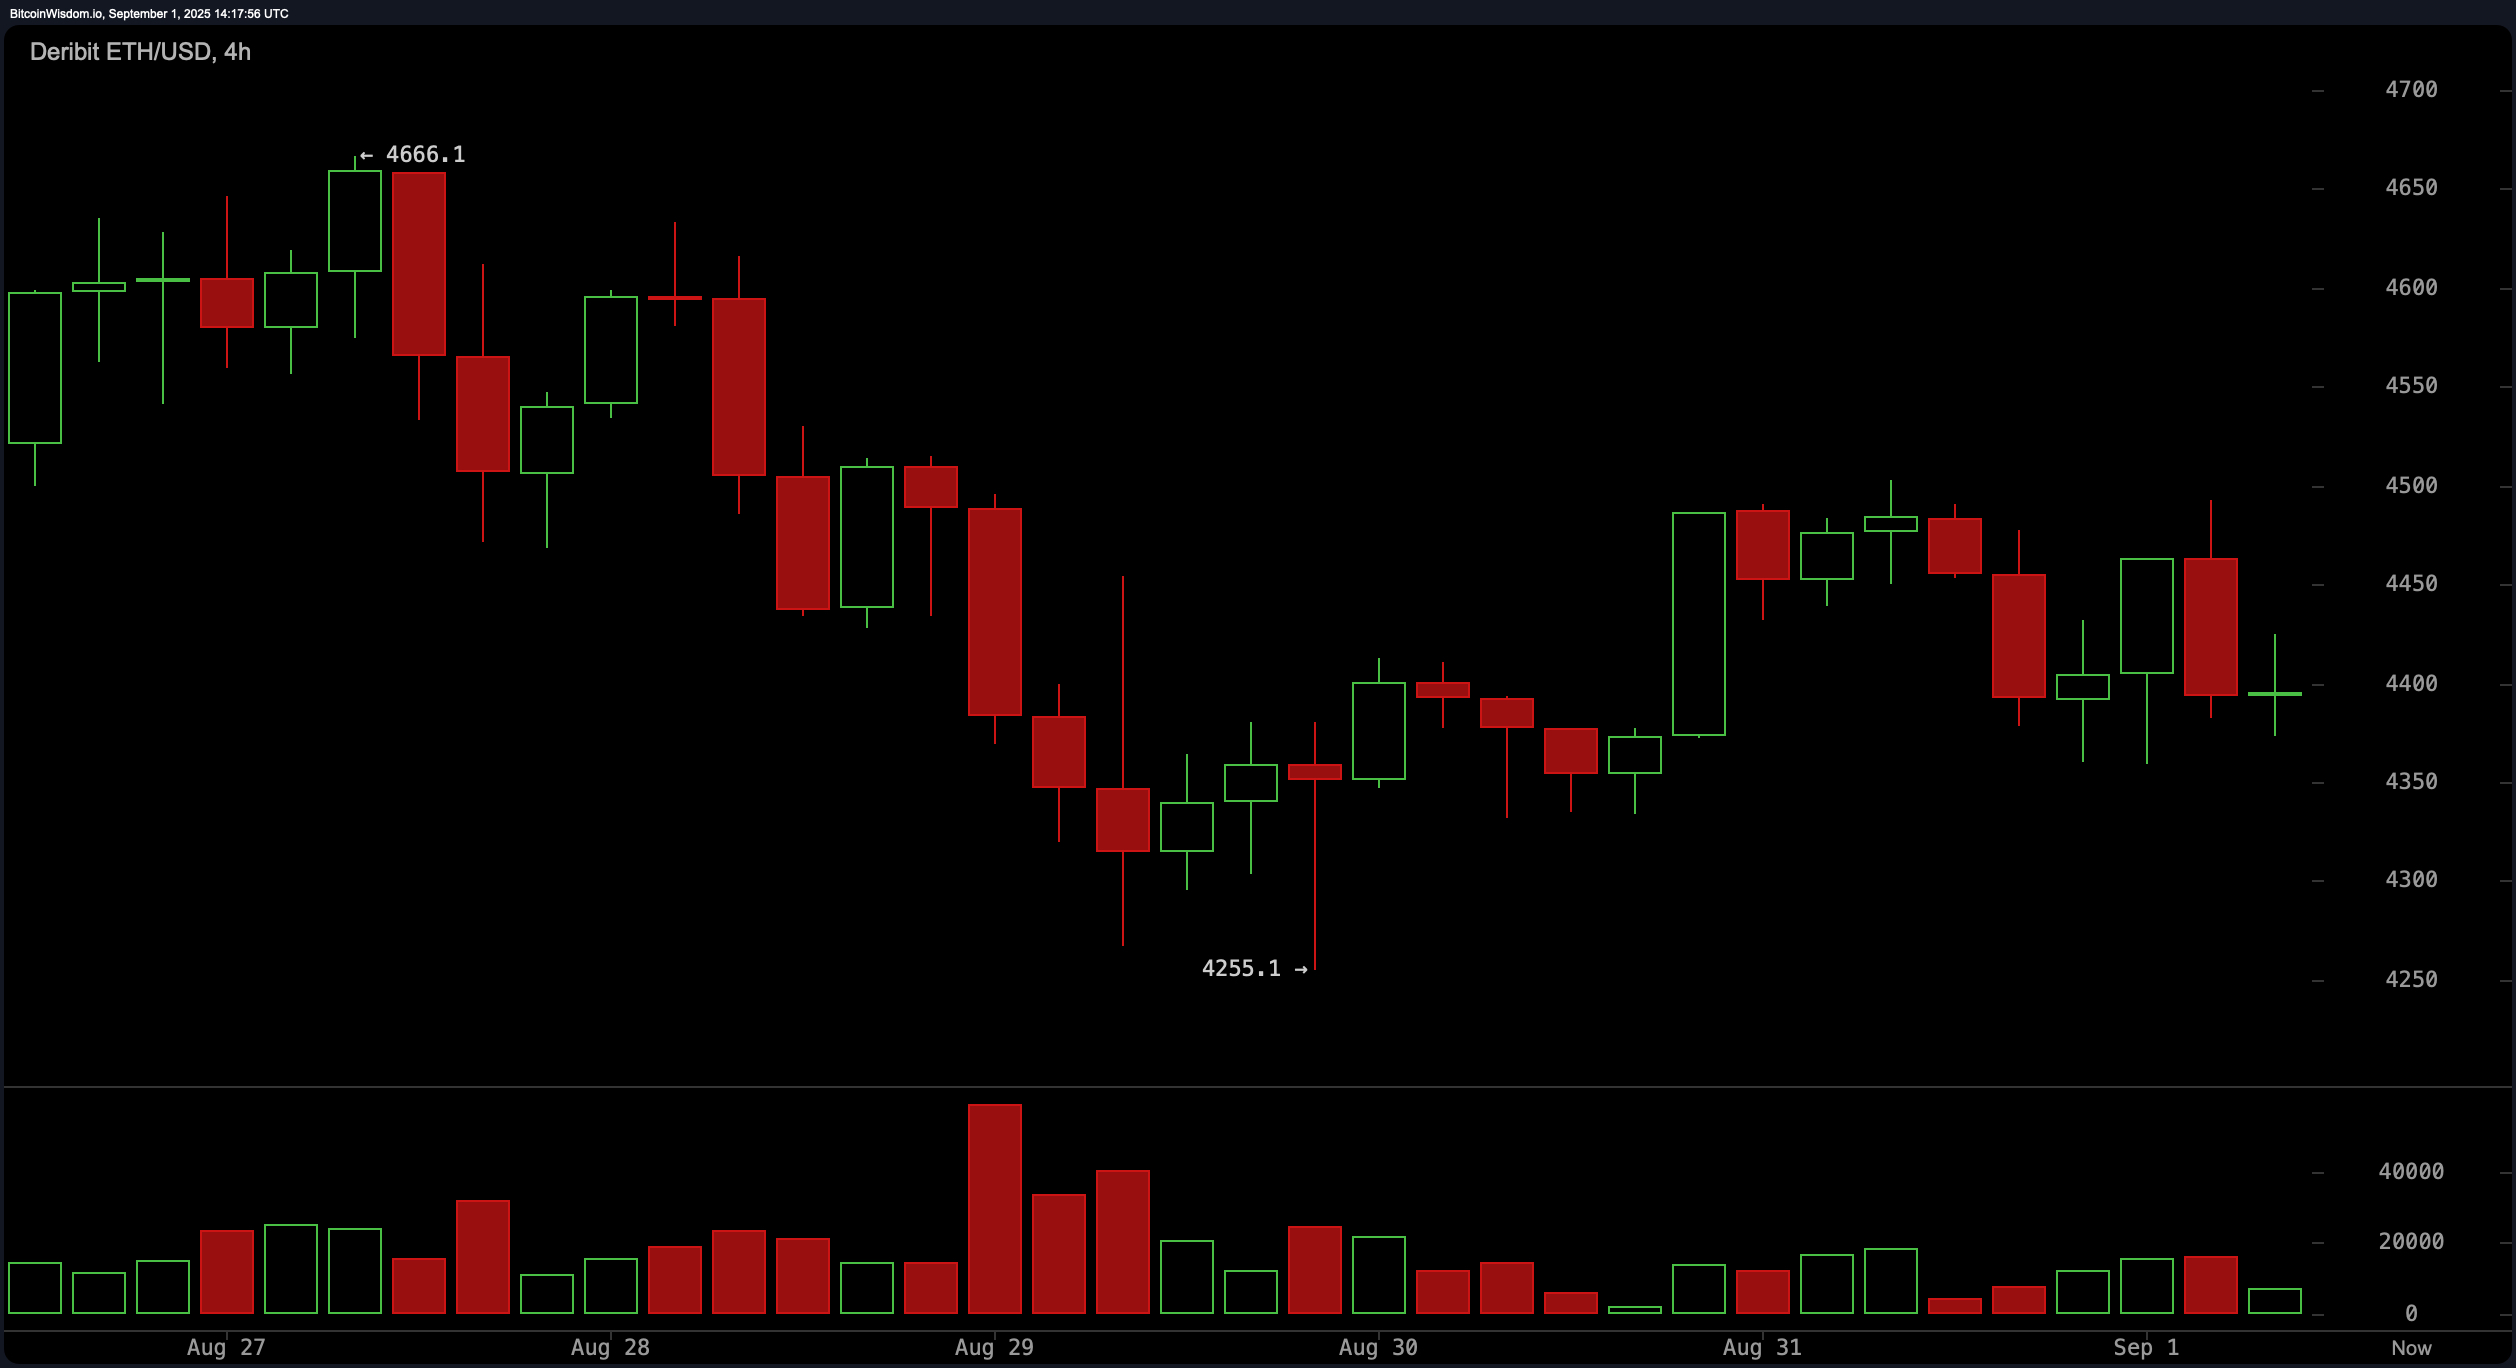
The 4-hour ethereum chart is like the grumpy neighbor who keeps saying, “I told you so.” Double top at $4,666.1? Check. Drop to $4,255.1? Check. Lower high near $4,500? Check. Red candles with higher volume? Oh, they’re having a party. Key support’s at $4,250, and resistance is stubbornly holding at $4,500. Traders, if $4,400 fails again, you might want to consider a short entry-just don’t forget your stops above $4,500. 🚀
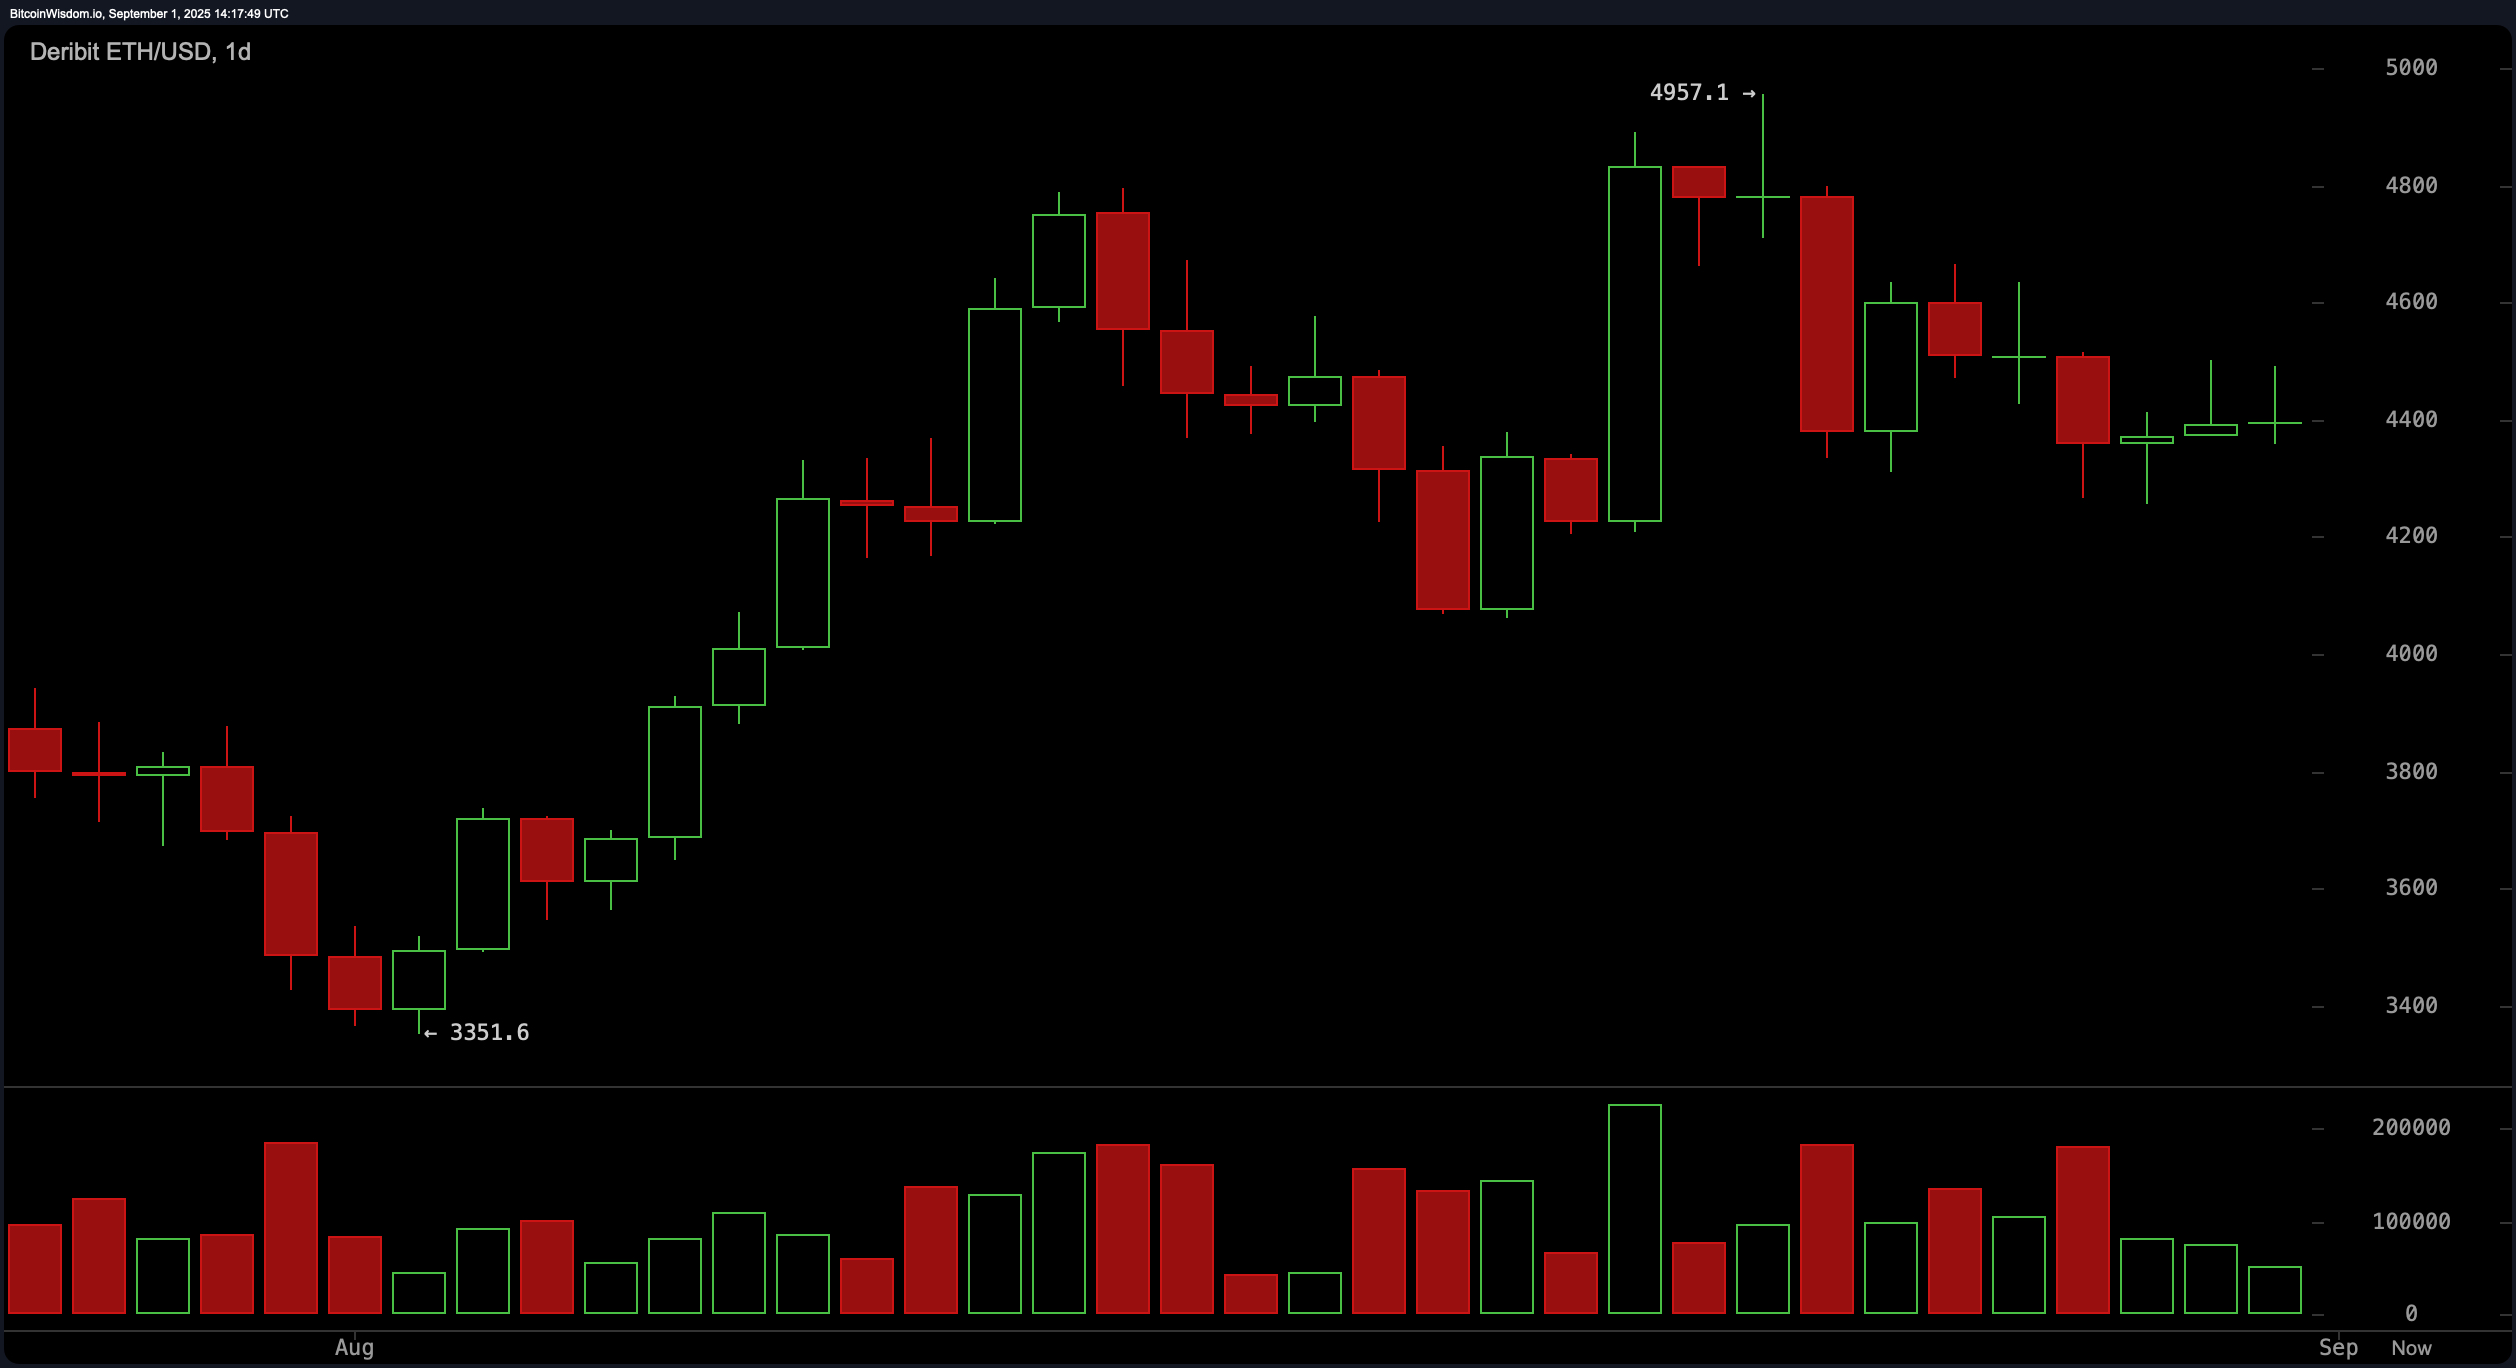
On the daily chart, ethereum looks like it’s stuck in a mid-life crisis. It had a great run from $3,351.6 to $4,957.1, but now it’s trapped in a $4,400-$4,600 range, muttering about lower highs and closes. Volume’s like, “Yeah, I’m tired,” and critical support’s at $4,200. A close above $4,700 with strong volume? That’s the equivalent of finding a $20 bill in your old jeans. 🤑
Momentum oscillators are like that friend who can’t make up their mind. RSI’s at 53.0, basically shrugging. Stochastic and CCI are at 36.5 and −32.4, respectively, like they’re playing a game of “Who’s more neutral?” Meanwhile, the momentum indicator’s at −429.8, screaming “bearish divergence!” while MACD’s at 123.3, whispering “sell, sell, sell.” Awesome oscillator and ADX? They’re just standing there, sipping tea. 🍵
Ether’s moving averages (MAs) are having a family feud. The 10-period EMA at $4,441.5 and SMA at $4,508.3 are like, “Bearish, duh.” But the 20, 30, 50, 100, and 200-period MAs are all like, “Long-term bullish, baby!” Especially the 200-period SMA at $2,688.2 and EMA at $3,120.8-they’re the grandparents of the group, insisting everything’s fine. 👵👴
🐂
Short-term volatility? Pfft. Ethereum’s got strong support and a long-term trend that’s like a rock. If it closes above $4,700 with volume, it’s back to the races, baby! August highs near $4,957? Here we come! 🚀
Bear Verdict: 🐻
Short-term charts are like, “Uh-oh.” Momentum’s weak, volume’s favoring sellers, and if it dips below $4,350, it’s correction city. Macro resistance at $4,500? Still a brick wall. Long positions? Maybe grab a raincoat. ☔
Read More
- Silver Rate Forecast
- Polymarket’s 3.14% Pie: A Slice of Genius or Just Crumbs?
- ONDO PREDICTION. ONDO cryptocurrency
- XRP’s Institutional Comeuppance: Finally, a Seat at the Table
- Gold Rate Forecast
- Brent Oil Forecast
- Coinbase’s OCC Nod: Not a Bank, Just A Trust-Big Moves Ahead!
- Claude’s ID Fiasco: Anthropic’s Latest Farce in AI Theatre
- Bitcoin’s Wild Ride: War, Oil, and Triangles, Oh My!
- Crypto’s Last Gasp: Lummis Pleads, ‘Act Now or Regret Eternally’
2025-09-01 17:58