At the moment, BTC is trading at $104,360, showing a 3.10% decline over the past 24 hours and a market cap drop to $2.07 trillion.
Price Breakdown and Volume Spike
Despite the decline, 24-hour trading volume has surged by 28.47%, reaching $67.97 billion, indicating aggressive activity—likely driven by liquidations and high-frequency trading as the price broke below support.
Key Levels to Watch (7-Day Chart)
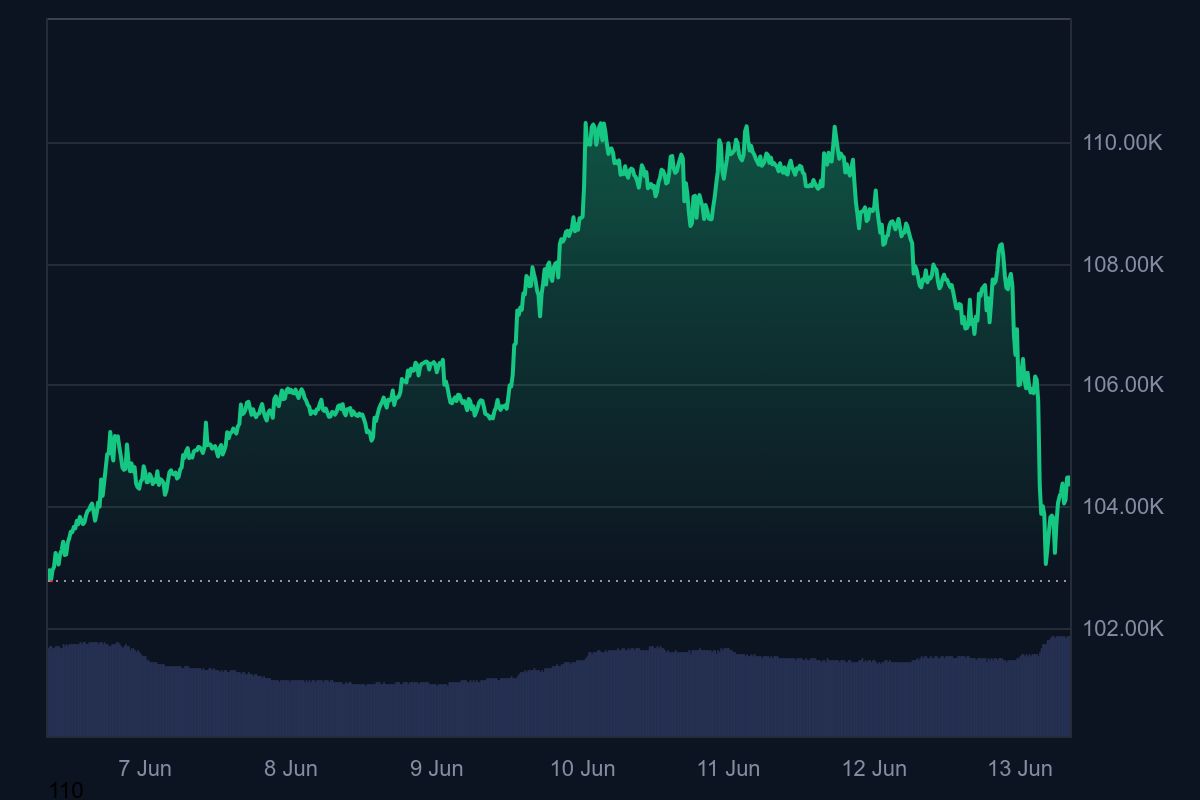
$110,000: This remains the primary resistance level, where BTC topped out on June 11 before facing strong selling pressure. A confirmed breakout above this zone would signal renewed bullish momentum.
$106,000: Previously a short-term support floor, this level failed to hold during the recent drop. Reclaiming it could indicate a recovery attempt.
$104,000: Now a psychological and technical support level. BTC briefly dipped below it but is attempting to stabilize just above this range.
$102,000–103,000: This is the next crucial downside zone to monitor. A sustained move below this range could trigger additional liquidations and extend the selloff.
Short-Term Outlook
The sharp decline follows a failed breakout attempt near $110,000 and coincides with broader market volatility, including increased liquidations across major exchanges. If BTC fails to reclaim the $106,000 level soon, further downside testing could occur, especially if volume begins to decline after the spike.
However, bulls may find an opportunity to re-enter if BTC holds the $104,000 region and consolidates with rising support.
Read More
- Gold Rate Forecast
- ETH PREDICTION. ETH cryptocurrency
- TRX: The Bullish Saga of $0.30 – Will the Whales Save Us? 🐋💰
- Silver Rate Forecast
- Solana’s Meltdown: $111M Longs Liquidate Like It’s Going Out of Style! 💸🔥
- Ride the Crypto Wave or Wipe Out – $250K Up for Grabs! 🌊💸
- BTC AUD PREDICTION. BTC cryptocurrency
- Dogecoin’s $2B Volume Spree: Bearish Brouhaha or Bullish Blunder? 🐕💸
- Bitcoin’s Bold $112K Move – Is It A Breakout Or A Breakdown? Find Out! 💥💸
- Trump’s Crypto Invasion: Blockchain Meets Bollywood Drama! 🎭💰
2025-06-13 08:53